Stack Ranking Explained: Why Many Companies Dropped It and Some Still Use It
Stack ranking forces a fixed share of staff into a bottom group. GE used a 20-70-10 curve and Microsoft dropped its version in 2013. What research found.

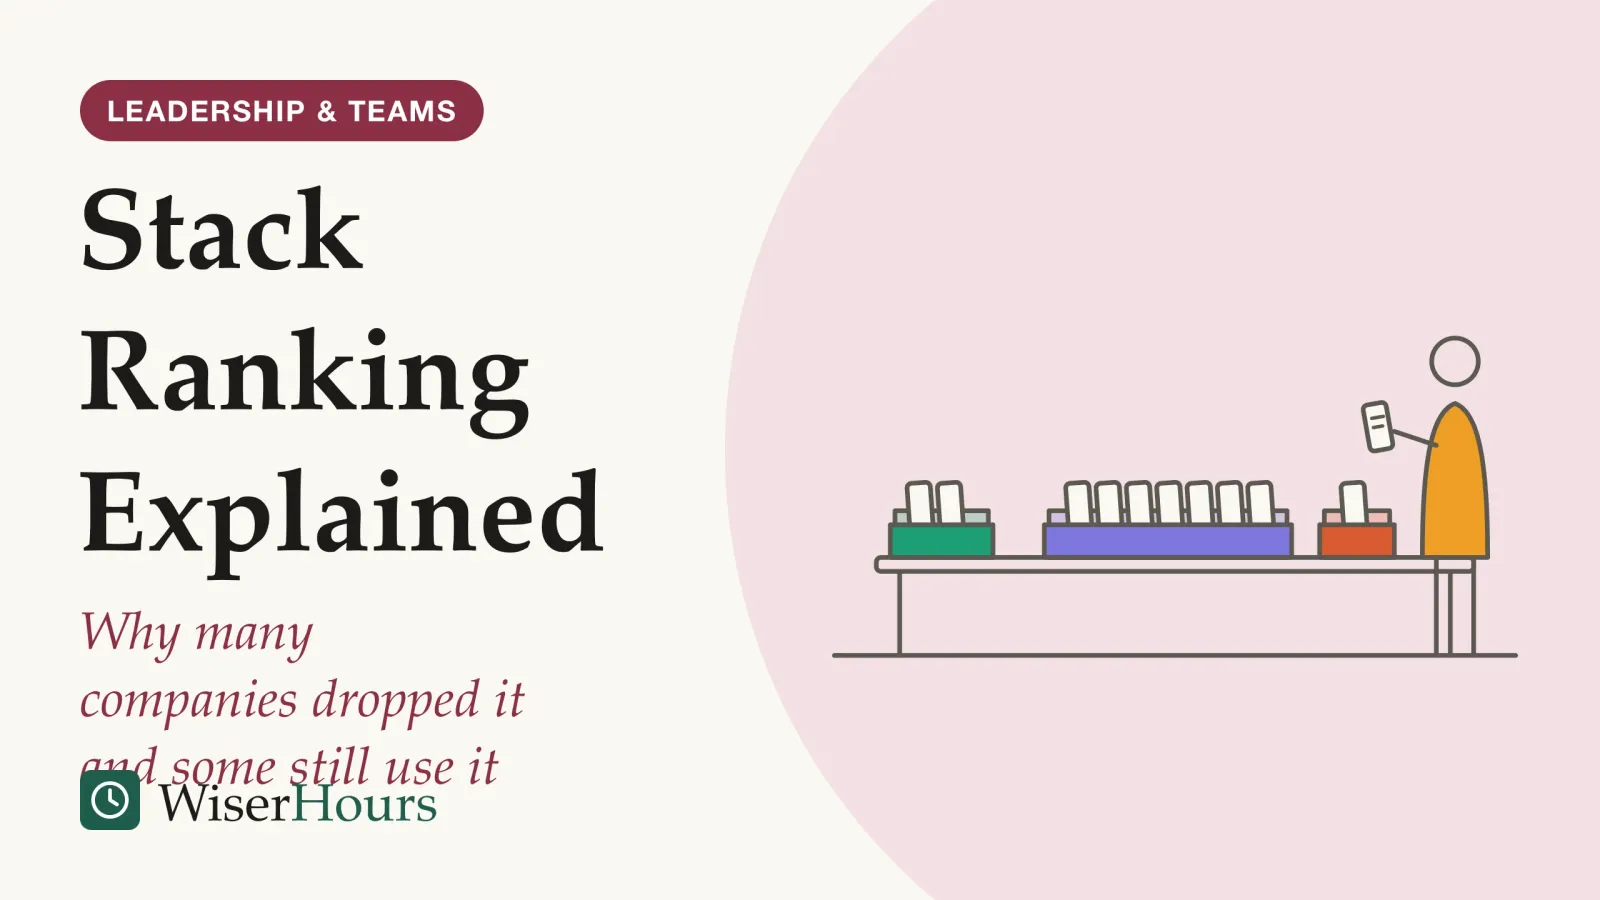
For about three decades, General Electric graded its employees on a “vitality curve”: a top 20 percent, a middle 70 percent and a bottom 10 percent, with those at the bottom often denied bonuses or laid off.1 That curve is the best-known form of stack ranking, a performance review method in which managers must place a set share of their staff in top, middle and bottom groups, whatever the team’s actual results. It is also called forced ranking or “rank and yank”.2 Microsoft dropped its own curve in 2013, saying it wanted more emphasis on teamwork.3 Laboratory experiments in Germany point to one reason: a forced curve sped up solo work but slowed teams down.4
What is stack ranking? Fixed slots, filled by comparison
Stack ranking rates employees against each other and then fills slots of a fixed size, so the share of people at the top and bottom is decided before anyone’s work is reviewed. Wikipedia’s entry on the vitality curve, which gathers the reported company cases, notes that many firms run it quietly under milder names such as “talent assessment”.2
Definition
Stack ranking is a review system that compares employees with one another and requires managers to put a preset share of them in each performance group, including a bottom group, regardless of how well the whole team performed.
Firms adopt it because ordinary ratings tend to be too generous and bunched in the middle, which makes strong and weak performers hard to tell apart. A forced curve is meant to counter both habits by making managers differentiate.4 The research behind that drift sits in a separate guide to running performance reviews people can trust.
A department of 40 people with four managers shows how it works. Under a 20-70-10 rule, each manager with 10 reports must name 2 at the top, 7 in the middle and 1 at the bottom. The managers then meet to defend their picks. Wikipedia’s account of IBM’s system describes such meetings as a contest for a limited number of good ratings, where an employee’s result depends partly on how well their manager argues and how much sway that manager has.2
Your rating under stack ranking says something about your work, but it also reflects who else sits in your comparison group and what happened in a meeting you did not attend.
What is the difference between stack ranking and forced distribution?
Forced distribution places people into preset percentage buckets by measuring each person against performance standards, while strict ranking orders people one against another from first to last, a 2002 Workforce article explains.5 In everyday use, “stack ranking” covers both, because both fix how many people can land in each group.
A sales team of 12 shows the difference. Under strict ranking, the manager lists all 12 from best to worst. Under forced distribution, the same manager only has to decide who goes in the top, middle and bottom buckets, but the bucket sizes are still set in advance.
Forced systems also differ in the details that matter most to the people inside them. A 2009 study by Brian Blume, Timothy Baldwin and Robert Rubin named four features that set them apart: what happens to low performers, how much more top performers earn, how often feedback comes and how large the comparison group is. In its study of 163 undergraduates rating hypothetical systems, the consequences for low performers weighed most.6
When someone says your company uses only a “guide” distribution, ask whether the percentages are targets managers may miss or limits they must meet. A limit makes it a forced system, whatever it is called.
Do companies still use stack ranking?
Some large companies still use systems with fixed or target shares, though rarely under that name. In May 2025, Business Insider reported on an internal Meta memo telling managers of teams of 150 or more to rate 15 to 20 percent of employees in the lowest group, up from the year before; Meta declined to comment.7
Wikipedia lists other employers reported to use forced or target distributions, including Amazon, based on a New York Times investigation of its yearly review meetings. How common the practice is remains hard to measure, because surveys use different definitions and companies describe their systems in softer terms.2
Look past the name. A system that calls itself “calibration” or “talent review” but caps the number of top ratings or requires a minimum number of low ones works like stack ranking for the people in it.
How to tell if your employer uses stack ranking, and what to do
Most employees learn about a forced curve indirectly: a manager mentions a “guide” distribution, ratings change after a meeting the employee did not attend, or a whole team that hit its goals gets the same small number of top ratings as a team that missed them. Plain questions, asked before the review cycle starts, can settle it.
Ask three things. Who else is in my comparison group? Is there a set number or share of top and bottom ratings, and is it a target or a limit? What does each rating mean for pay, promotion and exits? Alongside the answers, keep a dated record of your own results, written as you go, so your manager has evidence to argue with in the ranking meeting. If a low rating would start a formal process, read the written policy and keep a copy.
For managers, the performance review template helps keep evidence in the same form for everyone. Tell your team honestly how the system works, record helping and coaching as part of performance, because a fixed curve makes helping a colleague costly, and argue for larger comparison groups or targets in place of hard limits.
Signs your employer uses a forced curve
From GE’s vitality curve to Microsoft’s exit in 2013
General Electric under Jack Welch made forced ranking famous from the 1980s, and big employers that copied it later dropped it, Microsoft most publicly in 2013. In his 2001 book, Welch described sorting executives into “A”, “B” and “C” players and advised removing the C group, while admitting the judgments were not always precise.2
Microsoft’s version drew wide criticism. A 2012 Vanity Fair article by Kurt Eichenwald, “Microsoft’s Lost Decade”, reported executives saying that strong developers avoided working alongside other strong developers for fear of being hurt in the rankings.2 In November 2013 Lisa Brummel, Microsoft’s head of human resources, told staff by email that there would be no more ratings and no preset distribution of rewards, and more emphasis on teamwork and collaboration.3
- 1980sGE under Jack Welch ranks staff on a 20-70-10 vitality curve
- 2001Ford agrees to settle two US lawsuits over its A, B and C grading
- 2013Microsoft ends ratings and its preset curve
- 2015CNBC reports GE no longer practices forced ranking
- 2025Business Insider reports Meta raising its low-rating target
GE itself moved on: by 2015, CNBC reported, forced ranking was no longer practiced among its roughly 300,000 employees.1 Other firms reported to have dropped similar systems include Ford, Adobe and Accenture.2 These are company decisions and news accounts. They show what employers concluded, and no controlled test of the method sits behind any of them.
Why is stack ranking bad? Short-lived gains and unfair-feeling ratings
The research case against stack ranking is that its gains are front-loaded and narrow. Removing the weakest performers each year can lift a workforce at first, but in a 2005 simulation by Steven Scullen, Paul Bergey and Lynda Aiman-Smith of firms that fire a fixed share of staff every year, most of the gain came in the first several years.8 Lab experiments add that the effort boost holds mainly for work people do alone.4
The simulation suggested a forced firing system could noticeably improve a workforce’s potential. The gain grew with the share fired and shrank when more people left voluntarily.8 Because it was a computer model of potential, built on assumptions, it shows how the logic plays out rather than what happened in any real company, and nothing beyond its abstract is used here.
- Myth
- Firing a fixed bottom share every year keeps improving a workforce.
- Fact
- In the 2005 simulation most of the gain came in the first several years, and it depended on how many people left on their own.
Laboratory evidence is mixed in a useful way. In a 2013 experiment in Management Science, Johannes Berger, Christine Harbring and Dirk Sliwka found that people working on individual tasks produced somewhat more when their supervisors had to spread grades out, but the forced curve backfired once workers had a simple way to sabotage each other.9 The people doing the rating dislike it too. In two experiments, Deidra Schleicher and colleagues found raters judged a forced system harder to use and less fair than a traditional rating scale, especially when ratings fed administrative decisions such as pay and when the people being rated performed similarly.10
A warehouse picking team, where each person’s output is counted and nobody depends on anyone else, comes close to the conditions where a curve can push effort up. A product team that ships work together is the opposite case. Before defending or attacking a curve, look at how much of the work depends on colleagues.
Why forced curves hurt teamwork
When a colleague’s high rating lowers your own chances, helping them has a price, and a 2021 set of experiments showed people responding to that price. Linda Loberg, Stephan Nüesch and Nils Foege tested a forced rating system on tasks done alone and on tasks that needed a team to share information.4
The study
Limited evidence
Forced ratings and teamwork in three German lab experiments (Loberg, Nüesch and Foege, 2021)
Students who sorted cards alone worked faster when their supervisor had to split each bonus so that one person got the most, one got half as much and one got nothing. When the same task needed teamwork, teams under the forced system took about a fifth longer. In a task that depended on sharing clues, team members wrote fewer task-related messages and their estimates were about two and a half times as far off. People under the forced system rated their pay as less fair when the work was collaborative.4
The study was small, short and run with students, and the authors note that real review periods and stakes are far larger, which might strengthen its effects, good and bad. It also fits what Microsoft’s critics described, with strong people avoiding each other to protect their rankings.2
A support desk shows how it plays out. A senior agent who spends an hour coaching a new colleague loses an hour of personal output and may help a rival climb past them. Under a fixed curve, the sensible personal choice and the good team choice point in opposite directions. Managers who keep any form of ranking should count helping, coaching and shared work in the review, or expect less of it.
Performance is not always a tidy bell curve
A forced curve assumes performance in every group is spread in roughly the same shape, and that assumption is disputed. In a 2012 paper, Ernest O’Boyle and Herman Aguinis analysed 198 samples of researchers, entertainers, politicians and athletes and found that performance followed a power law, with a few stars far ahead of everyone else, instead of a bell curve.11
James Beck, Adam Beatty and Paul Sackett replied in 2014 that much of that skew came from how performance was measured. When measures covered comparable jobs, the full range of performers and many behaviors, a normal curve fitted better.12 The shape of performance in large populations remains contested.
- A team with mixed results: the bottom slot goes to the person who is clearly behind
- A strong team: everyone clears the bar, but a fixed curve still requires one bottom slot, so the label reflects the teammates more than the work
Neither side’s findings rescue a fixed curve applied to a small team. In a group of eight, a strong team may have no weak performer at all while a struggling team has three. Wikipedia’s summary of the criticism notes that people on an exceptionally talented team may leave if they know some of them will get lower grades than they would on a weaker one.2
Discrimination suits and dismissal rules by country
Forced rankings have drawn discrimination lawsuits, and the rules on dismissing someone for performance differ widely between countries. In the US, Ford agreed in 2001 to pay $10.5 million to settle two class actions claiming that its A, B and C grading system, which at first required at least 10 percent of those graded to get a C (later 5 percent), discriminated against older white men.13 Employees at Microsoft and Conoco, both US-based companies, also sued over ranking systems.2
The risk comes from how a curve works. When a fixed number of people must land at the bottom, any pattern in who lands there, by age, sex, race or nationality, is easy to see and hard to explain.
International standards set a floor in some places. Under the International Labour Organization’s 1982 convention on ending employment, a job should only be ended for a valid reason tied to the worker’s ability or conduct, or to the business’s operational needs, and a worker facing dismissal over conduct or performance should normally first get a chance to answer.14 Only 36 countries are bound by it, according to the ILO’s ratification list; a 37th, Brazil, ratified it and later withdrew.15 Elsewhere national law decides, and protection against dismissal varies widely.
Whether a low ranking can lead to dismissal, a pay cut or a performance plan depends on the country, the terms of your job and any collective agreement. If you are told your job is at risk, or are asked to sign a performance plan or settlement, contact a local employment adviser, lawyer, union or works council before you sign or respond. If a low rating is only noted on your record, raise it with HR or your manager during the review cycle. Your national labour authority explains the general rules where you work.
The bottom line
Stack ranking fixes how many people can succeed or fail before anyone’s work is reviewed, and the evidence suggests any boost it gives is short-lived and paid for in lost cooperation. If you work under one, keep a dated record of your results and ask how your comparison group and ratings are set. If you manage under one, argue from evidence and count the help people give each other.
This article is general information, not legal advice. Rules differ by country and change over time; for your own situation, speak to a qualified lawyer or an official advice service where you live.
Frequently asked questions
Is stack ranking the same as rank and yank?
Mostly. Rank and yank is the nickname for a stack ranking system in which the bottom group is pushed out, as was often the case at General Electric, where CNBC reported in 2015 that people at the bottom of the curve were often denied bonuses or laid off. Some forced systems only cut bonuses for the bottom group, which is why the consequences matter more than the label.
What happens to people placed in the bottom group?
It depends on the employer and the country. Reported cases range from lost bonuses and raises to formal performance plans and dismissal: at Ford in the US, CBS News reported in 2001, two C grades in a row could mean being let go. Ask your employer what the bottom rating triggers, and check local employment rules before acting on it.
Is stack ranking fair in small teams?
A fixed share is hardest to justify in small teams. It means a team of five strong people must still name a bottom performer, and a 2009 study by Brian Blume and colleagues found that the undergraduates it surveyed preferred forced systems with large comparison groups. If a curve is used at all, applying it across a larger group reduces the chance of labelling someone only because of who their teammates are.
Sources
- General Electric rethinks annual job reviews. Greene, K. (2015). CNBC, 19 August 2015
- Vitality curve. Wikipedia (encyclopedia entry; accessed 2026-11-07)
- Microsoft abandons employee-ranking system. Essers, L. (2013). Computerworld, 13 November 2013
- Forced distribution rating systems and team collaboration. Loberg, L., Nüesch, S. & Foege, J. N. (2021). Journal of Economic Behavior & Organization, 188, 18-35
- Forced ranking: A good thing for business? Sprenkle, L. (2002). Workforce, 20 June 2002
- Reactions to Different Types of Forced Distribution Performance Evaluation Systems. Blume, B. D., Baldwin, T. T. & Rubin, R. S. (2009). Journal of Business and Psychology, 24(1), 77-91
- Meta is about to start rating more workers as 'below expectations,' internal memo shows. Dixit, P. & Mann, J. (2025). Business Insider, May 2025
- Forced distribution rating systems and the improvement of workforce potential: A baseline simulation. Scullen, S. E., Bergey, P. K. & Aiman-Smith, L. (2005). Personnel Psychology, 58(1), 1-32
- Performance Appraisals and the Impact of Forced Distribution: An Experimental Investigation. Berger, J., Harbring, C. & Sliwka, D. (2013). Management Science, 59(1), 54-68
- Rater Reactions to Forced Distribution Rating Systems. Schleicher, D. J., Bull, R. A. & Green, S. G. (2009). Journal of Management, 35(4), 899-927
- The best and the rest: Revisiting the norm of normality of individual performance. O'Boyle, E. & Aguinis, H. (2012). Personnel Psychology, 65(1), 79-119
- On the Distribution of Job Performance: The Role of Measurement Characteristics in Observed Departures from Normality. Beck, J. W., Beatty, A. S. & Sackett, P. R. (2014). Personnel Psychology, 67(3), 531-566
- Ford Settles Employee Evaluation Suit. CBSNews.com staff with the Associated Press (2001). CBS News, 18 December 2001
- C158 - Termination of Employment Convention, 1982 (No. 158). International Labour Organization (1982). NORMLEX; text checked current on 2026-11-07
- Ratifications of C158 - Termination of Employment Convention, 1982 (No. 158). International Labour Organization. NORMLEX (accessed 2026-11-07)
How we researched this
Sources were found through OpenAlex, Crossref and journal pages, plus news reports and company accounts, in November 2026. They include a simulation, laboratory experiments, studies of rater reactions and the ILO convention, dating from 2001 to 2025. Main limitation: only one research paper was read in full; the others were read as abstracts, and no field study has tracked a forced ranking system against a comparison group over time.
Keep reading
Performance Review Templates: Questions and Rating Scales
A free performance review template with 9 sections, question banks for manager, self and peer reviews, 3 rating scales and how to write their anchors.
How to Run Performance Reviews: A Step-by-Step Guide for Managers
How to run performance reviews in 4 steps, and why a 2000 study found that ratings say more about the rater than about the person being rated.

The 30-60-90 Day Plan: A Template for New Hires and Managers
A 30-60-90 day plan template both sides can use: what the new hire writes, what the manager approves, 3 filled-in examples and a monthly review rhythm.
Offboarding: How to Handle Departures Well
Offboarding in 6 steps for managers: telling the team, handover, access, final pay, the exit interview and a goodbye that leaves the door open.