Compound Interest Explained: Why Starting Early Can Make Such a Difference
Compound interest explained: the formula in plain words, a worked table of early and late starters at 3, 5 and 7%, and what fees, inflation and tax take.

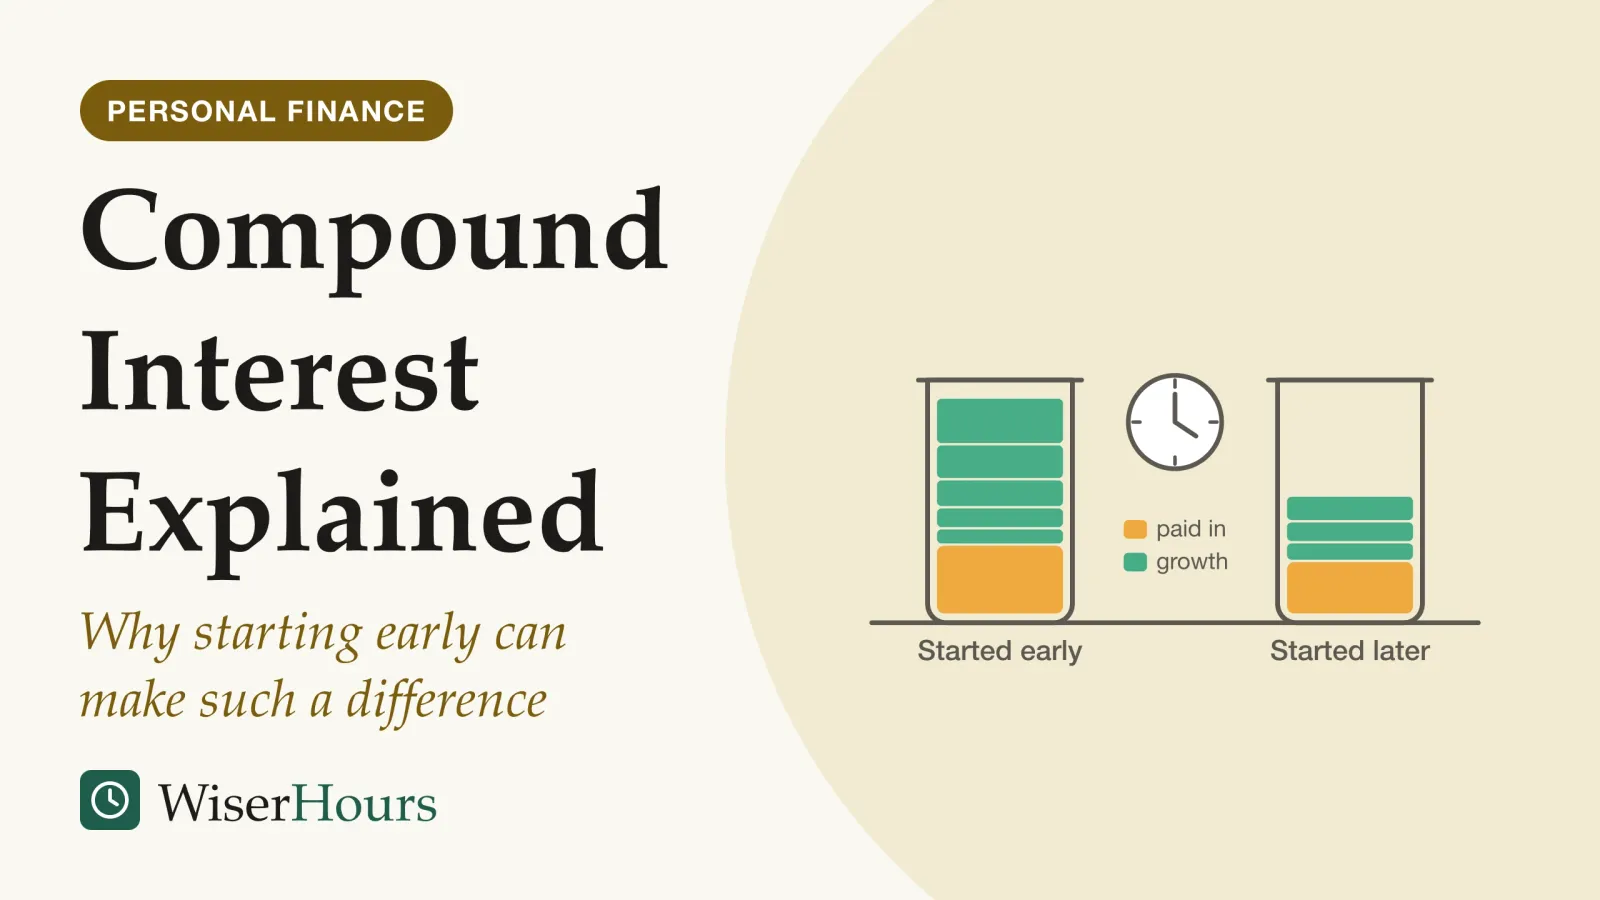
Ten years of early saving is often said to beat three decades of later saving. In our worked example that held only at the highest of three yearly rates we tried; at the two lower ones, the late starter who paid in three times as much finished ahead. What won at every rate we tried was starting early and continuing: a saver who paid in for the whole four decades ended well ahead of both.
That comparison is compound interest explained in miniature. The Securities and Exchange Commission (SEC), which regulates US markets, defines compound interest as interest paid on the sum you put in and on interest already added to it.1 Each year’s growth joins the balance that earns next year’s, so time does much of the work. In practice the arithmetic points to three things worth checking in your own plans: whether interest stays in the account, how many years each deposit gets, and what a projection looks like after fees and inflation. For the order of steps before anyone invests, see the beginner’s guide to investing; this page stays with the arithmetic.
Prefer to watch? The video covers the same ground as this article.
Compound interest explained: same rate, different results
Simple interest is paid on the original amount only, while compound interest is paid on the original amount plus any interest already earned, as Canada’s Ontario Securities Commission (OSC) explains. At the same rate, compound interest grows faster, and the gap widens every year.2
The OSC’s example starts with 100 at 5 percent a year. Simple interest adds the same amount every year. Compound interest works out each year’s interest on a slightly bigger balance, so the extra is tiny at first: after three years it is less than one unit.
| Year | Balance with simple interest | Balance with compound interest |
|---|---|---|
| 1 | 105 | 1052 |
| 2 | 110 | 110.252 |
| 3 | 115 | 115.762 |
That small early gap is why compounding is so easy to dismiss. Stretch the same idea over a working life: 1,000 left at 5 percent for 30 years, with nothing added or taken out, ends at 2,500 with simple interest and at about 4,322 when interest is added once a year. All of the difference is interest earned on earlier interest (our arithmetic, drawn below).
Compounding depends on the interest staying put. Compound interest is the result of reinvesting or keeping interest that would otherwise be paid out, and how often it is added (yearly, monthly, daily or only at maturity) changes the result slightly.3 Interest paid out to a current account and spent earns nothing further.
So when you open a savings account or a fund, check whether interest or income is added to the balance or paid out; money meant to grow has to stay in.
The formula in plain words, and where time sits
The standard compound interest formula multiplies the starting sum by one period’s growth, once for every period the money stays put. Here it is with each letter spelled out.3
The compound interest formula
A = P × (1 + r/n)^(n × t). The final amount (A) equals the starting sum (P) times one plus the yearly rate (r) divided by the number of times interest is added each year (n), raised to the power of that number times the years (t). At 5% added once a year, the bracket is 1.05, and three years means multiplying the starting sum by it three times.
Two parts do the work. The bracket is the growth in a single period. The power is where time sits: the bracket is multiplied by itself once for every period, so time is not added to the result but multiplies it. That is why, in many examples, extra years matter more than a slightly higher rate.
Picture two colleagues who put the same sum into the same account at the same rate, one of them a decade sooner. Each unit earns the same interest in any given year, yet the first colleague’s money has been through ten more rounds of multiplication, and each round works on a larger balance than the last.
You do not need to do this by hand. The SEC’s free compound interest calculator on Investor.gov asks for the starting amount, what you add each month, how many years, an estimated rate and the compounding frequency. It also takes an “interest rate variance range”, so you see results above and below your estimate rather than one number.4

A better way to use a calculator
Run the same savings plan three times: at a low, a middle and a higher rate. Then run it again with the start moved five years later. Comparing the four results teaches more about compounding than any single projection.
Why compound growth is easy to underestimate
Compounding is one of the least understood ideas in personal finance. In the OECD’s 2023 international survey of adult financial literacy, under half of adults in the countries and economies covered answered a basic compound interest question correctly, although most could work out the interest on a simple loan.5
The study
Moderate evidence
Five years at 2%: the savings question most adults missed (OECD/INFE, 2023)
Adults aged 18 to 79 in 39 countries and economies (68,826 respondents) were asked how much 100 would be worth after five years in a tax-free savings account paying a fixed 2% a year. Only 42% answered correctly (more than 110), and only 26% got both that answer and the first-year sum right. Among adults who held a savings, investment or retirement product, 46% understood compound interest.5
The survey measures knowledge, not behavior, and the OECD cautions that a few national samples may not represent their whole adult populations.5 Still, the pattern fits the arithmetic above. In the early years, compound growth looks almost exactly like simple growth, so an estimate built on the first few years misses what happens later. Someone checking a new savings account after its first year sees a few units of interest and reasonably concludes the effect is small; the same account decades later looks nothing like that first statement.
Early starter vs late starter: a worked table
Starting early helps because the first deposits have the longest time to multiply, but how much it helps depends on the rate. Our worked example compares three savers who each pay the same sum every month, and it shows when the famous start-early claim holds and when it does not.
| Saver | Pays in 100 a month (any currency) | Total paid in |
|---|---|---|
| Early starter | from age 25 to 35, then stops and leaves the money alone | 12,000 |
| Late starter | from age 35 to 65 | 36,000 |
| Steady saver | from age 25 to 65 | 48,000 |
Assumptions behind the table
Each payment goes in on the last day of the month, and returns are compounded monthly at the same rate every year, with no fees, tax or inflation. Everyone is counted at the same age, when the late and steady savers make their last payment. This is our own arithmetic with the formula above, not a forecast.
All three savers are ordinary and none is lucky: the only differences are when they start and whether they stop. Real lives are less tidy, since income, caregiving and debts decide when many people can begin, which is why the late starter’s column matters as much as the early one.
| Assumed yearly return | Early starter (10 years of payments) | Late starter (30 years) | Steady saver (40 years) |
|---|---|---|---|
| 3% | about 34,000 | about 58,000 | about 93,0003 |
| 5% | about 69,000 | about 83,000 | about 153,0003 |
| 7% | about 140,000 | about 122,000 | about 262,0003 |
Returns in practice change every year and can fall below the lowest rate shown, or below zero. With no return at all, each saver ends with exactly what they paid in; if the money shrank by 2 percent a year, both the early and the late starter would finish with less than they put in.
The early starter’s win over the late starter needed the top rate; lower down, three times the contributions came out ahead. The one result that held at every positive rate is the steady saver’s lead: the earliest deposits compound for longest, and later ones keep adding to the base.
Paying in a fixed sum every month, as all three savers do, is also the habit behind investing each paycheck rather than waiting to invest a lump sum. To test your own plan, rerun the table in the SEC calculator with your actual monthly sum and starting age, once at a low rate and once at a higher one.4
Savings interest is set in advance; investment growth is not
Compound interest on a savings account is paid at a rate the bank sets in advance, and a fixed-rate product holds that rate for its term, in a way that investment growth never is. Deposits are often insured up to a limit, while stocks and funds can fall in value; in the US, the SEC explains, deposit insurance covers deposits only, and no insurance covers investments against a loss in value.6
The OSC notes that fixed-return products such as GICs, a Canadian kind of term deposit, use compound interest.2 In the US, FDIC deposit insurance covers 250,000 dollars per depositor, per insured bank, for each account ownership category, as of 2026.7 The SEC points to the trade-off: that security comes with a low interest rate.6 Deposit insurers from around the world belong to the International Association of Deposit Insurers, which sets standards for their schemes; what a scheme covers, and up to what limit, is for you to check where you bank.8
Investments compound too, but only on what they return, and those returns swing. The SEC’s page on risk notes that large-company US stocks, taken together, have fallen in value in about one year of every three on average.6 An average return also hides the order in which gains and losses arrive, which matters because each loss shrinks the base that later gains work on.
- Myth
- An investment that averages 7% a year grows like a savings account paying 7%.
- Fact
- A savings rate is paid every year. Investment returns jump around: a 50% gain followed by a 50% loss averages zero, yet turns 100 into 75. The smooth line in a calculator is an assumption.
Growth inside a fund, such as an index fund that tracks a whole market, compounds only when its income is reinvested, and only on whatever the market delivers. A calculator’s investment line is therefore one possible path, and the low-rate version is the one to look at before relying on it.
Fees, inflation and tax: how much growth you keep
Fees, inflation and tax can each take a slice of the return every year, and because compounding works on what is left, the slices add up over time. A return before inflation is the nominal return; after it, the real return, which the European Central Bank (ECB) defines as the nominal rate minus inflationinflation: A general rise in the prices of goods and services over time, so that the same amount of money buys less. Returns are often reported after inflation, in real terms, to show what a gain is worth in buying power.Full entry in the glossary.9
In the ECB’s example, a saver whose interest rate is a little below the rate at which prices rise ends the year with more euros that buy less than before: a real return below zero.9 Take the earlier 1,000 again and suppose prices rise 3 percent a year: the number in the account does not change, but what it buys shrinks a lot.
Fees work like a steady leak. The SEC explains that ongoing fees reduce the amount of money in your portfolio that is earning a return, so even small ones have a big effect over time.10 In our example, taking one percentage point a year off the return, for fees or tax, leaves roughly a quarter less at the end of the same 30 years (see the figures below).
The long-run record shows the same gap on a larger scale. In the Global Investment Returns Yearbook 2026 by Dimson, Marsh and Staunton, published by the bank UBS and not peer-reviewed, one US dollar put into US stocks in 1900 had grown to about 124,854 dollars by the end of 2025, but to only about 3,296 in real terms, because US prices rose about 38-fold.11 That record belongs to one country, and the Yearbook’s own disclaimer warns that past performance is no indication of future results.11
Tax takes its slice when interest or gains are taxed each year. Tax-advantaged accounts can offer tax deductions, tax-deferred growth or tax-free withdrawals, the SEC explains for the US, and it suggests consulting a tax professional on the rules.12 Most OECD countries give some financial incentive to save for retirement, but the OECD’s 2025 report describes each country’s tax rules in a separate profile (rules as of July 2025), so check those that cover your own savings.13
A calculator run with a rate after fees and expected inflation gives a smaller answer, but one much closer to what the money will buy.
The bottom line
Time is what compound interest multiplies, since each year’s gains begin earning in the years that follow. In our worked table, starting early and continuing beat both the early quitter and the late starter at every rate. Savings interest can be fixed and insured, investment growth is uncertain and can be negative, and fees, inflation and tax shrink both, so judge any projection in real terms and over a range of rates. When a choice turns on your own tax position or circumstances, an adviser regulated in your country, or a tax specialist there, can go through the figures with you; your own financial regulator’s free consumer pages, such as Investor.gov in the US or GetSmarterAboutMoney.ca in Ontario, Canada, are a place to start.
This article is general education, not financial advice. For decisions about your own money, speak to a qualified, regulated adviser.
Frequently asked questions
How often is interest compounded, and does it matter?
It depends on the account: interest can be added yearly, monthly, daily or only at maturity, and more frequent compounding gives slightly more at the same stated rate. Banks in many markets also quote an annual equivalent rate, called AER, APY or the effective annual rate depending on the market, which includes the effect of compounding. Where one is shown, compare those figures, not the headline rates.
Do dividends and fund returns compound like interest?
They can, if you reinvest them. Canada's Ontario Securities Commission explains that compounding comes from putting earnings back into the original investment, whether that is a bond, a stock or a fund. Dividends taken as cash and spent stop compounding. Unlike interest on a savings account, though, the growth of stocks and funds is not guaranteed and can be negative.
Does compounding still help if I start in my 40s or 50s?
Yes, whenever returns are positive. The Ontario Securities Commission says it is never too late to start, even though a longer time horizon gives compounding more to work with. In our worked table, the late starter who saved for 30 years still ended with more than they paid in at every positive rate. Fewer years left means each year's saving matters more, not less.
What rate should I put into a compound interest calculator?
There is no right single rate, which is why the SEC's Investor.gov calculator lets you enter a range above and below your estimate. For a savings account, use the rate the bank quotes. For investments, try several rates, including low ones, and subtract expected fees and inflation. Historical averages describe the past and are not promises.
Sources
- Compound Interest (glossary). U.S. Securities and Exchange Commission, Investor.gov
- How does compound interest help your money grow? Ontario Securities Commission (Canada), GetSmarterAboutMoney.ca, last updated 24 October 2025
- Compound interest. Wikipedia (accessed 28 September 2026)
- Compound Interest Calculator. U.S. Securities and Exchange Commission, Investor.gov
- OECD/INFE 2023 International Survey of Adult Financial Literacy. OECD (2023). OECD Business and Finance Policy Papers, OECD Publishing, Paris
- What is Risk? U.S. Securities and Exchange Commission, Investor.gov
- Understanding Deposit Insurance. Federal Deposit Insurance Corporation (US), checked current on 2026-09-28
- About IADI. International Association of Deposit Insurers
- What are interest rates and what is the difference between nominal and real interest rates? European Central Bank (25 May 2016)
- How Fees and Expenses Affect Your Investment Portfolio: Investor Bulletin. U.S. Securities and Exchange Commission, Office of Investor Education and Assistance (23 July 2025)
- Global Investment Returns Yearbook 2026: public summary edition. Dimson, E., Marsh, P. & Staunton, M. (2026). UBS
- Tax-Advantaged Accounts. U.S. Securities and Exchange Commission, Investor.gov
- Annual survey of financial incentives for retirement savings: Country profiles 2025. OECD (December 2025), rules as of July 2025, checked current on 2026-09-28
How we researched this
For this page we read, in September 2026, investor-education pages from the US SEC (Investor.gov), the US FDIC and Canada's Ontario Securities Commission, the European Central Bank's explainer on real interest rates, the OECD/INFE 2023 adult financial literacy survey of 39 countries, the OECD's 2025 report on retirement savings incentives and the public summary of the UBS Global Investment Returns Yearbook 2026. The worked examples are WiserHours arithmetic, not forecasts. Chief limitation: the long return record quoted is from a single country, the US, and past returns do not predict future ones.
Keep reading
Investing for Beginners: How It Works and Where to Start
Investing for beginners: how stocks, bonds and funds work, what 126 years of US returns show, and 7 steps based on US and UK regulators' guidance.
Stocks vs. Bonds: How Their Risks and Rewards Differ
Stocks vs bonds: owning versus lending, who is paid first if a company fails, the risks of each, and why US stocks and Treasuries both fell about 18% in 2022.
Is Gold a Good Investment? What History Shows and What It Doesn't
Is gold a good investment? It pays no income, lost about three-quarters of its buying power after US inflation from 1980 to 2001, yet held up in some crashes.
What Are Dividends? A Plain-English Explainer for First-Time Investors
What are dividends? Cash or shares a company pays its owners. Why they are part of your return, not extra, and the 3 main ways a payout can reach you.