The Change Curve Explained: How People React to Workplace Change
The change curve turns Kübler-Ross's 1969 stages of dying into 4 or 5 workplace stages. What research found, and what managers can do at each point.

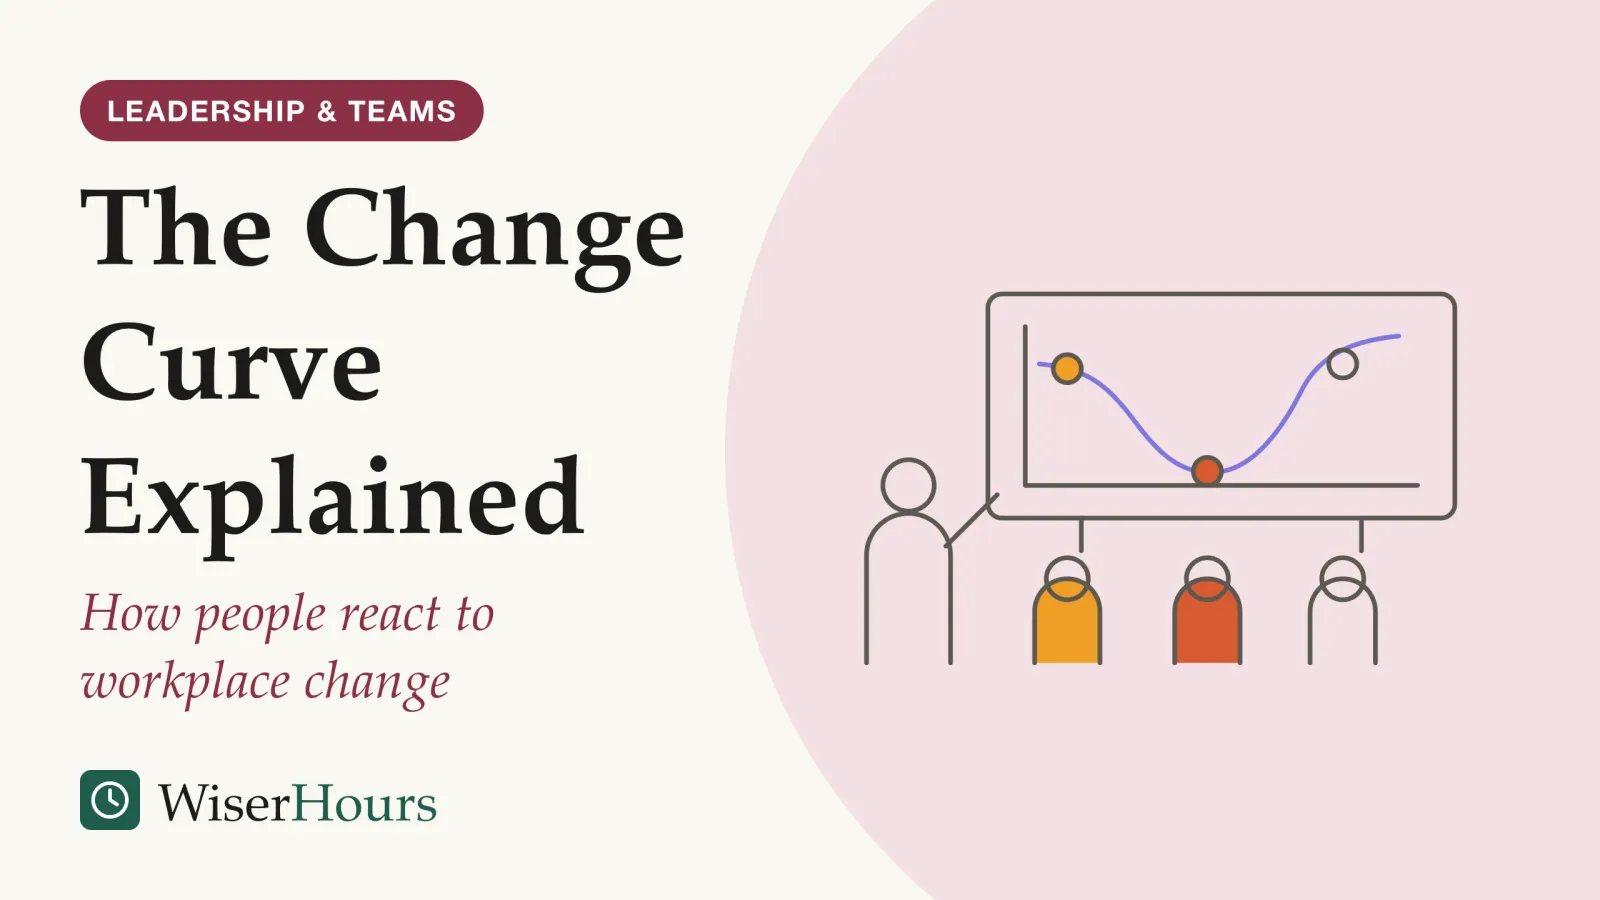
The change curve is a diagram of how people tend to react to an unwelcome change at work: morale and output dip through shock and resistance, then recover as people explore the new way and accept it. It is borrowed from Elisabeth Kübler-Ross’s 1969 account of how dying patients responded to their diagnosis.1 Research on grief finds little support for a fixed order of stages.2
Use the curve for its labels, which name what a manager may hear in the weeks after an announcement, and drop any timetable for when people ought to be over it. In practice that means explaining why the change is happening, asking each person what it means for their work and expecting your team to sit at several points at once. It belongs with the other leadership and management skills that a reorganization tests hardest.
What are the stages of the change curve?
Common versions of the change curve have four or five stages. The University of Exeter’s change guidance for its own staff in the UK uses four: denial, resistance, exploration and commitment.3 The change-management firm Prosci keeps the five Kübler-Ross named: denial, anger, bargaining, depression and acceptance.4
Both draw the stages along a line that falls and climbs again, with time running left to right. The dip has a wider pedigree than grief. In a 2002 review, P. David Elrod and Donald Tippett compared models of change from a range of disciplines and found that most of them describe a loss of capability in the middle of the process.5
The reason is easy to see in ordinary work. A new structure, system or boss makes old expertise less useful before new skill exists. The university’s line-manager toolkit points out that a person may have been the expert in the old way of doing things and earned respect for it, and the change undermines that position.6 In a finance team moving to a new reporting tool, the analyst who knew every shortcut in the old spreadsheet is suddenly slower than the new hire, and much of the irritation comes from losing that edge rather than from the software.
The names keep shifting. The same model also circulates as “the seven stages of grief”, and Kübler-Ross described more reactions than the famous five, including shock, hope and a grief that comes before the loss itself.1 Pick whichever version your organization already uses and hold its labels loosely. What matters is noticing that a drop in mood and speed after a change is a common reaction, which Prosci frames as normal and expected.4
- Myth
- Everyone goes through the stages of the change curve, one after another.
- Fact
- Kübler-Ross herself wrote that her patients often showed two or three stages at once, and grief research finds little support for a set order.
What managers can say and do at each stage
Use the change curve to anticipate what you may hear, then answer the specific worry each person raises. The table pairs each common reaction with steps from the University of Exeter’s staff guidance, Prosci’s guide and a field study by Tina Kiefer. The advice in the two guides comes from practitioner experience and has not been tested as an intervention.
| Reaction you may meet | What it can sound like | What tends to help |
|---|---|---|
| Shock or denial | “This won’t affect us.” “They’ll drop it soon.” | Explain the reason: what problem the change solves, why now and what it should achieve. Then repeat it.3 |
| Anger or resistance | Complaints about fairness, protest, sharp questions in meetings | Listen to concerns, discuss options and help each person plan a route through the change that works for them.3 |
| Bargaining | Requests for exceptions or delays | Clarify expectations, explain why the change is needed and give people the skills the new way needs.4 |
| Low mood or withdrawal | Quietness, less effort, talk of leaving | Ask about job security, working conditions and how they feel treated, the three perceptions Kiefer’s study linked to negative emotions during change.7 |
| Exploration | Testing the new tool, “what if we tried…” | Involve people in working out the new routines, since they know how the current system works.3 |
| Acceptance or commitment | New habits, people teaching each other | Celebrate progress and keep reinforcing the new way so people do not drift back to the old one.3 |
Read the table as a menu with no fixed order. People move back and forth, and a team will be spread across several rows at once.4 Your one-on-one meetings are where you find out which row each person is in, with a direct question such as “What does this change mean for your work?”
Your usual leadership style still applies. The extra work during a change is listening for the specific worry behind a reaction and fixing what you can: a training gap, an unclear decision, a sense of being treated unfairly.
Is the change curve the same as the Kübler-Ross model?
The change curve is a business adaptation of the Kübler-Ross model, not the model itself. Elisabeth Kübler-Ross, a Swiss-American psychiatrist, described five stages in her 1969 book On Death and Dying, which grew out of seminars and interviews with dying patients at the University of Chicago.1 The book drew on her contact with more than 200 dying patients.2
The workplace version came later. Wikipedia’s history, citing a management website, dates the move from grief to the “Kübler-Ross Change Curve” to the 1980s.1 Her own chart looked different. The Elisabeth Kübler-Ross Foundation, which now uses a registered-trademark sign on the Change Curve name, describes her 1969 chart as ten overlapping bands, including shock, partial denial, preparatory grief and hope, and says that by 1978 she drew the responses as interlocking circles with no timeline and no numbered order.8
- 1969On Death and Dying names five stages of dying
- 1974Kübler-Ross notes patients show two or three stages at once
- 1978She draws the responses as circles with no order
- LaterThe stages move into workplaces as the change curve
- 2007A Yale study tests the stages on bereaved adults
- 2017A review urges professionals to drop the stages
In a 1974 follow-up book she wrote that most of her patients had shown two or three stages at the same time, and not always in the same order.1 Her last book, written with David Kessler and published in 2005, put it this way:
they are not stops on some linear timeline in grief. Not everyone goes through all of them or in a prescribed order
She called her stages a heuristic device, categories separated out for clarity, and her main aim was more patient-centered care for the dying.1 Borrow them for a team in the same spirit: they help you name what someone tells you in a conversation, and they do not predict what that person will feel next.
What grief research found when it tested the stages
Grief researchers who tested the stages found the reactions Kübler-Ross named but little evidence of a sequence. A 2017 review in the journal Omega by Margaret Stroebe, Henk Schut and Kathrin Boerner concluded that bereaved people do feel some of these emotions some of the time, that the ordered stages lack empirical support, and that professionals should stop using them.2
A widely cited test followed bereaved adults in one US state for two years.1
The study
Limited evidence
Acceptance from month one: the Yale Bereavement Study
The Yale Bereavement Study interviewed 233 adults in Connecticut, US, between 1 and 24 months after a family member died of natural causes. Acceptance was the reaction people endorsed most often from the first month on, and yearning, which is not one of Kübler-Ross’s five, was the strongest negative reaction throughout. Once each reaction was rescaled, the peaks lined up in the order stage theory predicts: disbelief, then yearning, anger, depression, with acceptance rising all along.9
Both readings of that study can be true at once. A group average can rise and fall in a rough order while individual people mix the reactions, and acceptance was there from the first month. Critics writing to the same journal argued against the stage idea and questioned which participants had been left out of the analysis.1
George Bonanno of Columbia University adds a larger point in a 2004 review in American Psychologist: in bereavement studies that report group data, people showing relatively low depression or distress approached or exceeded half the sample, while lasting distress appeared in a smaller minority.10 Many people show little visible dip, a pattern covered in more depth in what research shows about resilience after hardship.
The practical risk runs the other way too. Stroebe and her colleagues warn that a belief in stages can leave bereaved people feeling they are not grieving properly and can lead friends and professionals to give the wrong support.2 At work, telling a calm colleague that they must still be “in denial” does the same damage. Describe the range of reactions to your team and leave each person to place themselves.
Does everyone go through the change curve?
No. Research on employees finds that reactions to change vary with the person, the change and how it is run. Shaul Oreg, Maria Vakola and Achilles Armenakis reviewed 79 quantitative studies published between 1948 and 2007 and traced reactions to the people affected, the organization’s existing climate, how the change was handled, whether people expected to gain or lose, and what the change itself was.11
The reason is that one announcement means different things to different people. The same restructure can remove one person’s team and give another a promotion. Say a manager tells five people their department is merging with another: one shrugs, one is angry about losing a project, one is excited about a bigger scope, one asks a dozen practical questions, and one quietly updates a CV. The textbook curve is an average that may describe none of them.
- Fairly level: little visible distress; in bereavement studies, a large share of people
- Dip and recover: the textbook shape, which some people do follow
- Dip and stay low: a smaller group whose distress lasts
- Back and forth: reactions that return and overlap, as Kübler-Ross herself described
What sets off the low mood is more specific than the stage labels suggest. In a field study of ongoing change, Tina Kiefer found negative emotions were linked to three perceptions: an insecure future, inadequate working conditions, and inadequate treatment by the organization. Those emotions predicted lower trust and more withdrawal, both at the time and a month later.7 Observational data like these cannot show that fixing the three perceptions lifts anyone’s mood, yet each is something a manager can ask about.
Prosci, which sells its own method, lists the same weakness in the curve: it assumes everyone moves through the stages in a line, while in practice reactions overlap, repeat or cycle back.4 Plan for several reactions at once, and find out which one each person is having before you decide what they need.
How long does the change curve last?
We found no study that measured how long people take to move through the change curve at work, so any timetable attached to it is a guess. The nearest data come from bereavement, a far heavier loss. In the Yale study, the negative reactions peaked within about six months on average.9 Bonanno’s review describes time-limited disruption lasting from several months to a year or two in considerable numbers of bereaved people.10
Those are averages from grief, and they should not be read as a target for a team adjusting to a new schedule. What the workplace research does offer is a set of conditions linked to how open people become. In a study that measured the same employees at more than one pointlongitudinal study: A study that measures the same people more than once over a period of time, so it can see how they change and which thing came first. Following people over time still does not show that the earlier thing caused the later one.Full entry in the glossary in a reorganizing workplace, Connie Wanberg and Joseph Banas found that people who received more information about the changes, felt more able to cope with them and had taken part in the decisions were more open to them. Lower acceptance went with less job satisfaction, more irritation at work and stronger intentions to quit.12
Two offices going through the same system change show why that matters. In one, the manager explains the reason, asks the team how to phase the switch and books practice sessions before the go-live date. In the other, the news arrives by email the Friday before. Nobody can promise the first office a shorter dip from an observational study, but every factor in it is something a manager can influence.12
The bottom line
The stages of the change curve give you names for the reactions you will hear after an announcement, and the workplace studies suggest where your effort goes further: people who get more information, take part in the decisions and feel able to cope tend to be more open to a change. Before you announce the next one, write down why it is happening, decide which parts the team can still shape and book time for people to practice the new way.
Frequently asked questions
Does the change curve apply to changes people want?
Less often. Prosci, a change-management firm, notes that the curve is usually linked to unwelcome change. Shaul Oreg and colleagues' 2011 review of workplace studies lists whether people expect to gain or lose among the drivers of their reactions, so someone who is promoted in a restructure may skip the dip entirely while a colleague in the same meeting falls into it.
What is the valley in the change curve?
The valley is the low point, where morale and performance sit lowest before they recover. P. David Elrod and Donald Tippett's 2002 review, titled The Death Valley of Change, found that most of the change models they compared describe a loss of capability in the middle of a change. It is the stretch to plan training and extra support for.
Should I show my team the change curve?
It can help, if you present it as a range of common reactions. Prosci argues that it frames reactions as normal and expected. Grief researchers Margaret Stroebe, Henk Schut and Kathrin Boerner warn that stages used as a guide can make people feel they are not coping properly, so never tell someone which stage they are in.
Sources
- Five stages of grief. Wikipedia (accessed 17 October 2026)
- Cautioning Health-Care Professionals: Bereaved Persons Are Misguided Through the Stages of Grief. Stroebe, M., Schut, H. & Boerner, K. (2017). Omega: Journal of Death and Dying, 74(4), 455-473
- How do people react to change? University of Exeter (UK), Change Blueprint staff guidance (accessed 17 October 2026)
- Applying the Kübler-Ross Change Curve to Change Management. Prosci (change-management consultancy; commercial guide, accessed 17 October 2026)
- The "death valley" of change. Elrod, P. D. & Tippett, D. D. (2002). Journal of Organizational Change Management, 15(3), 273-291
- How do I support my team through change? University of Exeter (UK), Colleague Wellbeing line manager toolkit (accessed 17 October 2026)
- Feeling bad: antecedents and consequences of negative emotions in ongoing change. Kiefer, T. (2005). Journal of Organizational Behavior, 26(8), 875-897
- 5 Stages of Grief. Elisabeth Kübler-Ross Foundation (accessed 17 October 2026)
- An empirical examination of the stage theory of grief. Maciejewski, P. K., Zhang, B., Block, S. D. & Prigerson, H. G. (2007). JAMA, 297(7), 716-723
- Loss, trauma, and human resilience: Have we underestimated the human capacity to thrive after extremely aversive events? Bonanno, G. A. (2004). American Psychologist, 59(1), 20-28
- Change Recipients' Reactions to Organizational Change: A 60-Year Review of Quantitative Studies. Oreg, S., Vakola, M. & Armenakis, A. (2011). The Journal of Applied Behavioral Science, 47(4), 461-524
- Predictors and outcomes of openness to changes in a reorganizing workplace. Wanberg, C. R. & Banas, J. T. (2000). Journal of Applied Psychology, 85(1), 132-142
How we researched this
In October 2026 we read Wikipedia, the Elisabeth Kübler-Ross Foundation's history of the stages, two UK university staff pages and Prosci's guide for how the change curve is described, then searched PubMed, OpenAlex and Crossref for tests of the stage model of grief and for reviews of employees' reactions to organizational change, 1969 to 2018. Main limitation: we found no large or independent test of the change curve itself at work, and five of the twelve sources could be read only as abstracts.
Keep reading
How to Manage Managers: What Changes When You Lead Leaders
How to manage managers: 5 changes for skip-level leaders, from delegating problems to judging yourself by your managers' teams. Practitioner evidence.
Theory X and Theory Y: What McGregor's Idea Still Teaches Managers
Theory X and Theory Y are a manager's assumptions about people, not two styles. What McGregor argued in 1960, the thin evidence and how to spot X habits.
Matrix Management: How to Lead When People Report to Two Bosses
Matrix management gives people two bosses. A 2015 US Gallup survey linked it to weaker role clarity; 5 practices help the two managers agree who decides what.
The GROW Model Explained: A Simple Coaching Framework for Managers
The GROW model runs a coaching talk in 4 stages: Goal, Reality, Options, Will. Questions for each stage, a worked one-on-one and the evidence behind it.