Renting vs. Buying Your Home: The Wealth-Building Case for Each
Renting vs buying: US owners' median net worth is about 43 times renters', yet much of that gap reflects who buys. What decides which builds more wealth.

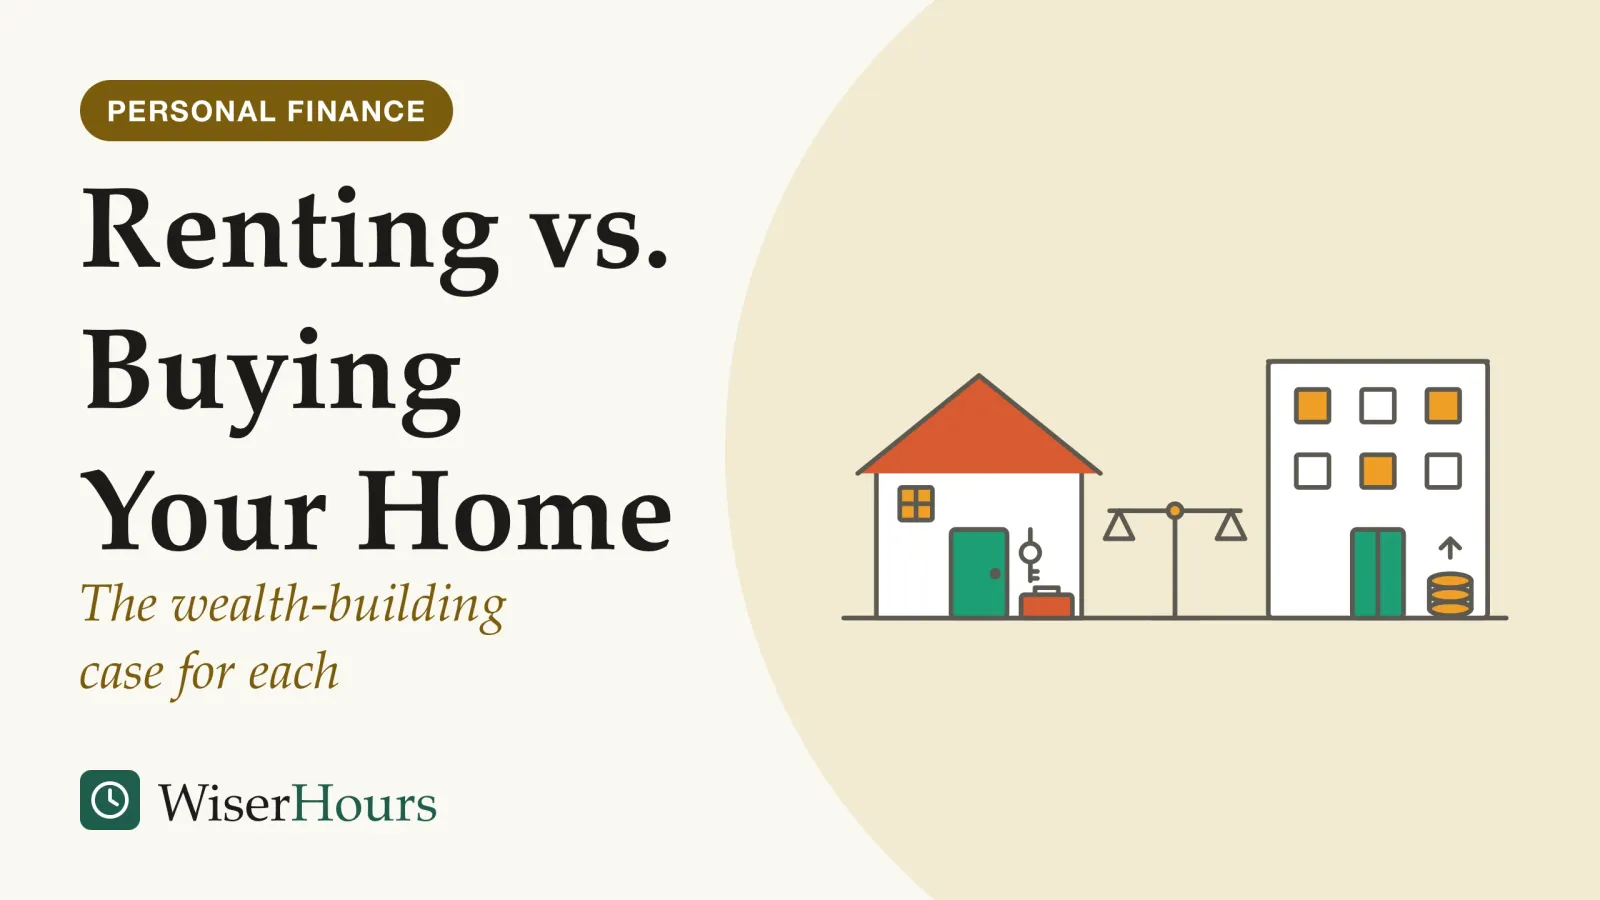
The median US homeowner family has a net worth about 43 times the median renter family’s, in the Fed’s 2025 Survey of Consumer Finances, yet that gap says more about who buys than about what buying does.1 Renting vs buying has no universal winner. Which one builds more wealth depends on local prices compared with local rents, how many years you stay, the costs of buying, owning and selling, your mortgage rate against what your savings could earn, and whether you would invest the money that renting frees up.
If you are weighing a home against other ways of earning from money, the honest definition of what passive income is and is not sets the wider frame.
Is it better to rent or buy a house financially?
Buying is better financially only when the local numbers line up, and in US history they often did not. A 2012 study in Real Estate Economics by Eli Beracha and Ken Johnson found renting the better investment strategy over most of the US period it covered, once the holding period was set to the average American’s time in one home.2 As a later paper describes their method, the renter in the model invested whatever renting saved each year, and the comparison was of ending wealth.3
A homebuyer puts a large sum into one asset, and the deposit, buying costs and early repairs could have gone into shares and bonds instead. If house prices in that city rise slowly while those investments do well, the renter who invests ends up ahead. If prices rise fast and rents climb behind them, the owner wins.
The study
Mixed evidence
Beracha and Johnson (2012), Real Estate Economics
With the holding period set to the average American’s time in one home, renting proved the better investment strategy over most of the years studied. The authors hypothesize that a rush toward ownership can push home prices above their fundamental value.2
Arthur Cox and Richard Followill built on that method in the Journal of Financial Planning in 2018, testing six US cities over 1984 to 2013. Assuming a 15 percent federal tax rate, renting came out ahead in five of the six over horizons of about a decade; over three decades the cities split evenly, with owning far ahead in San Francisco and renting still ahead in Stamford, Chicago and Miami.3 Both studies use past US prices, taxes and returns, so they show which conditions favored each choice; they cannot forecast your city.
Before deciding, ask whether your area looks more like Stamford, where prices grew slowly from a high start, or San Francisco, where prices and rents both climbed fast.
What is the 5% rule for renting vs buying?
The 5% rule is a quick test from Benjamin Felix, a Canadian portfolio manager, set out in The Globe and Mail in 2019. Multiply the home’s price by 5 percent to estimate an owner’s yearly unrecoverable costs, then compare that with a year’s rent on a similar home. If the rent is lower, renting costs less in money that never comes back.4
That total is Felix’s rough sum of three costs. Property tax and maintenance he puts at about 1 percent of the home’s value each. The remaining 3 percent is the cost of capital: the extra return your own money in the house could have earned in stocks, which he expects to beat housing over time. On the borrowed part, he treats mortgage interest as roughly offset by the home’s expected price growth. Felix works for an investment firm, and his estimate assumes an all-stock investor; a more cautious investor would use a lower figure.4
- Property tax: roughly 1% of the home’s value a year in Felix’s estimate; check your local rate
- Maintenance: roughly another 1% a year, also Felix’s rough estimate; your home’s needs may differ
- Cost of capital: roughly 3% for an all-stock investor: what your money in the home could earn in stocks beyond the home’s own growth
- A year of rent: for a comparable home; if it is below the 5% total, renting has the lower unrecoverable cost
UK averages from the Office for National Statistics show how to run the test.5
Five percent of that price comes to roughly £1,140 a month, below the average rent, so on these averages the rule leans toward buying. The two averages describe different homes, though, and the property tax slice is a Canadian estimate. In Britain, GOV.UK guidance as of 2026 says council tax is usually paid by whoever lives in the home, renters included, so you would drop that slice.6
Local spread matters more than any national average. The ONS found that in 2025 an average home cost about 4 times typical full-time earnings in the most affordable council areas of England and Wales and about 25 times in the least affordable.7 Run the rule with a price and a rent from the same street and the same kind of home, and with the tax that applies where you live. If the result is close, the worksheet below adds buying and selling costs, tax relief and how long you stay.
Why do homeowners have more wealth than renters?
Homeowners have more wealth partly because of who they were before they bought. The same Fed survey found that the medianmedian: The middle value when numbers are put in order, so half fall below it and half above. Unlike the average (mean), it is not pulled up or down by a few very large or very small values, which is why it is often used for incomes and wealth.Full entry in the glossary homeowner family had about twice the income of the median family that rents or otherwise does not own, and the Fed notes that homeownership rates rise with income.1
The net worth comparison mixes cause and effect. To buy, a household usually needs a deposit, a steady income that satisfies a lender, and some years of working life behind it. Those same traits predict wealth whether or not anyone buys. Cox and Followill flag the same issue from the other side: many renters rent because they lack a deposit, so assuming they could buy is unrealistic.3
A nurse and a software developer illustrate it. The developer, earning more, buys in her early thirties; the nurse rents. Two decades later the developer is far wealthier. Part of that comes from the house, part from the higher pay, and a net worth table cannot separate the two.
- Myth
- Owners are richer than renters, so buying makes you richer.
- Fact
- Owners tend to start with higher incomes and the savings for a deposit, so the survey gap reflects who buys as well as what buying does.
When you see the owner-versus-renter gap quoted as proof that buying pays, ask whether it compares people with the same income, age and savings. The headline figures do not. Your own net worth calculated step by step tells you more about your position than any national median.
Does renting and investing the difference beat buying?
Renting and investing the difference can beat buying, but only if the investing happens. When Johnson presented the analysis he ran with Beracha at the US National Association of Realtors’ 2011 conference, renters who invested every saving ended up with more in about 9 in 10 of the areas studied; when renters were assumed to spend the savings instead, buyers came out ahead in most cases.8 Those figures come from a trade-press report of an industry conference session rather than a peer-reviewed paper, so read them as rough estimates.
The second result is the forced-savings argument. A repayment mortgage turns part of every payment into home equity, whether or not you feel like saving that month; a renter has to make the same choice by hand, every month.
Better evidence comes from the Netherlands. In 2013 the Dutch government required new standard mortgages to be fully repaid over their term. Comparing households that bought before and after the rule, economists Asaf Bernstein and Peter Koudijs, writing in The Quarterly Journal of Economics in 2024, estimate that each extra euro of required repayment went almost one for one into household wealth, even five years later; households mostly cut spending and leisure rather than other saving.9
A renter can copy the mortgage’s forced saving with an automatic transfer into investments on rent day, sized to what owning would cost. If you doubt you would keep it up, give forced saving extra weight; the gap between what funds earn and what investors actually earn after their own buying and selling shows how often good intentions slip.
How long do you need to stay to make buying worth it?
Buying usually needs years to pay off, because buying and selling costs come out of the first years’ gains. Cox and Followill’s six-city comparison found renting usually ahead over shorter horizons, with ownership gaining ground the longer a family stayed put.3 No single break-even year applies everywhere, because the costs differ.
Some of those costs are taxes. In England and Northern Ireland, as of 2026, a buyer who has owned before, and will own only this home, pays £4,750 in Stamp Duty Land Tax on a £295,000 home, though first-time buyers get relief; Scotland and Wales have their own taxes.10 For US buyers, the Consumer Financial Protection Bureau lists appraisal fees, title insurance and government taxes among typical closing costs, and notes that costs rolled into the loan or rate are still paid.11 Selling adds agents’ and legal fees again.
A couple expecting a job move in three years may lose most of any price gain to these costs twice over. A family settling for fifteen years spreads the same costs thin. If you cannot say with some confidence how long you will stay, Cox and Followill suggest waiting until that is clearer.3
Mortgage rates, investment returns and borrowed money
The mortgage rate and the return you expect on investments pull in opposite directions. A cheap mortgage lowers the cost of owning; strong investment returns raise what a renter’s savings can earn. Cox and Followill found that higher investment returns favored renting in their historical comparison, though they stress that future returns are hard to predict.3
Borrowing also magnifies results. Take a hypothetical home bought with a deposit of a tenth of its price. If the price rises by a tenth, the owner’s equity doubles before costs; if it falls by a tenth, the whole deposit is gone.
Tax rules tilt the comparison, and they are national. In the US, mortgage interest is deductible only for those who itemize deductions, on up to $750,000 of home purchase debt for loans taken out since late 2017, according to the IRS guide for the 2025 tax year.12 Cox and Followill found that a higher tax bracket made buying more attractive in every city they tested.3 Elsewhere, your national tax authority’s guidance shows how it treats mortgage interest, property taxes and the sale of a main home.
A renting vs buying worksheet for your own numbers
Fill in one year of costs for a home you would buy and a similar home you would rent, using local prices, your own rates and your country’s taxes. Lines marked as saving still count toward your wealth.
| Yearly line | If you buy | If you rent |
|---|---|---|
| Housing payment | Mortgage interest only; repaid principal is saving | Rent, plus renters’ insurance 3 |
| Property or local tax | Your local rate on the home’s value | Only where residents pay it, as with UK council tax 6 |
| Maintenance and repairs | Your estimate; Felix uses about 1% of value | Usually the landlord’s 4 3 |
| Return on the deposit | Given up while it sits in the house | Earned, if you invest it 4 |
| Monthly saving | Principal repaid each month | The cost gap, invested automatically 9 |
| Buying and selling costs | Taxes and fees, divided by years you expect to stay | None, beyond moving costs and a deposit 10 |
| Tax relief | US interest deduction only if you itemize; check your country | Usually none 12 |
Total each column and compare. Then change one assumption at a time (years of staying, investment return, price growth, including years when prices or investments fall) and see which one flips the answer; that line deserves the most thought.
Before you fill in the worksheet
Some owners later let the home out instead of selling it. That turns a home into a small business, with the costs and legal duties that being a landlord involves.
What the spreadsheet leaves out: flexibility and security
Renting buys flexibility, and owning buys control. Renters can move more easily, for a new job for example, and repairs are usually the landlord’s job; owners get steadier payments on a fixed-rate loan, a stake that builds as the loan is repaid, and the pride many feel in owning, Cox and Followill note.3
How much each is worth depends on where you live. Eurostat reports that in 2024 most people in EU households lived in homes their household owned, but in Germany renting was the more common arrangement.13
Weigh the things a spreadsheet cannot price: how likely a move is, how you would cope with a sudden repair bill, and how much a landlord’s decisions would unsettle your household.
Where to get advice on your own numbers
Your income, savings, taxes and plans settle the question, so independent advice helps, especially before a first purchase. Wherever you live, your national financial regulator’s register shows whether an adviser is authorised, many governments run a free money-guidance service, and it pays to find out how an adviser is paid before you agree to anything.
In the US, the CFPB’s search tool lists housing counselors approved by the Department of Housing and Urban Development, who give independent advice on buying and renting, often at little or no cost.14 In the UK, the Financial Conduct Authority’s Firm Checker and Financial Services Register show whether a mortgage or financial adviser is authorised.15
The bottom line
Buying tended to come out ahead in the historical US studies for long stays in cities where prices and rents rose quickly, and renting for shorter stays where prices were high relative to rents, provided the renter invested the difference. No national average can tell you which of those describes your street. Fill in the worksheet with a price and a rent from your own area, then test the assumption you trust least before you commit.
This article is general education, not financial advice. For decisions about your own money, speak to a qualified, regulated adviser.
Frequently asked questions
Is renting just throwing money away?
Not by Benjamin Felix's reckoning. The Canadian portfolio manager argued in The Globe and Mail in 2019 that renting wastes no more than owning does, because owners also pay costs they never get back: property tax, maintenance and the cost of the money tied up in the home. What matters is which bundle of unrecoverable costs is smaller where you live.
Is renting long term normal in other countries?
In parts of Europe, yes. Eurostat's Housing in Europe 2025 reports that in 2024 about two-thirds of people in EU households lived in a home their household owned, but in Germany renting was more common than owning, with 53% of people living as tenants. In Romania, by contrast, 94% lived in owned homes. Housing law, tax and rental markets differ widely between countries.
Does the 5% rule still apply if you buy a home without a mortgage?
Yes. Felix's own worked example assumes the home is bought outright for cash. The cost of capital is then the return the money could have earned elsewhere, which he put at 3% of the home's value a year for a stock investor. A more cautious investor would use a lower figure. Paying cash removes the interest bill, but the money still has a cost.
Sources
- Changes in U.S. Family Finances from 2022 to 2025: Evidence from the Survey of Consumer Finances. Board of Governors of the Federal Reserve System (US) (October 2026)
- Lessons from Over 30 Years of Buy versus Rent Decisions: Is the American Dream Always Wise? Beracha, E. & Johnson, K. H. (2012). Real Estate Economics, 40(2), 217-247
- To Rent or Buy? A 30-Year Perspective. Cox, A. & Followill, R. (2018). Journal of Financial Planning, May 2018
- Should you rent or buy a home in Canada's current real estate market? Here's how the 5% rule changes the debate. Felix, B. (24 July 2019, updated 19 November 2021). The Globe and Mail
- Private rent and house prices, UK: September 2026. Office for National Statistics (UK) (16 September 2026)
- Council Tax: who has to pay. GOV.UK (UK government)
- Housing affordability in England and Wales: 2025. Office for National Statistics (UK) (26 March 2026)
- American dream lives on: U.S. will remain homeowners, says NAR. Valuation Review (21 November 2011), reporting a session at the National Association of Realtors' 2011 conference
- The Mortgage Piggy Bank: Building Wealth Through Amortization. Bernstein, A. & Koudijs, P. (2024). The Quarterly Journal of Economics, 139(3), 1767-1825
- Stamp Duty Land Tax: residential property rates. GOV.UK (UK government), HM Revenue and Customs
- What fees or charges are paid when closing on a mortgage and who pays them? Consumer Financial Protection Bureau (US) (last reviewed 11 September 2024)
- Publication 936 (2025), Home Mortgage Interest Deduction. Internal Revenue Service (US) (page updated 30 April 2026)
- Housing in Europe: 2025 edition. Eurostat (European Commission) (2025)
- Find a housing counselor. Consumer Financial Protection Bureau (US)
- How to check a firm or individual is authorised. Financial Conduct Authority (UK) (updated 22 September 2026)
How we researched this
In October 2026 we read the Federal Reserve's report on the 2025 Survey of Consumer Finances, the abstract of Beracha and Johnson's 2012 paper and a full-text 2018 follow-up study, the abstract of a 2024 Dutch study of mortgage repayment, ONS and Eurostat housing statistics, and current IRS, GOV.UK, CFPB and FCA pages. Main limitation: the key rent-or-buy studies use historical US data and assume renters invest every saving, which few households do.
Keep reading
Rental Property for Beginners: What Being a Landlord Actually Involves
Rental property for beginners: who owns rentals, what running one costs, and landlords' legal duties in the US and England, checked against 2024-2026 sources.
Assets vs. Liabilities: A Plain-English Guide to Your Personal Balance Sheet
Assets vs liabilities explained: where 7 tricky items go, from a mortgaged home to pay-later plans and tax bills, and a one-page balance sheet to fill in.
Dividend Reinvestment Explained: How Payouts Compound Over Time
How dividend reinvestment grows a holding: a hypothetical example where 100 shares become about 219 in 20 years, plus the tax, records and risks to know.
Net Worth by Age: Why Comparison Charts Mislead
Net worth by age from the Fed's 2025 survey and Britain's ONS, medians beside means, and five reasons comparison charts mislead.