The Behavior Gap: How Investors End Up Earning Less Than Their Own Funds
Fund investors often earn less than their funds report. How the behavior gap is measured, why estimates range from about 8.5 points to 0.1, and what to do.

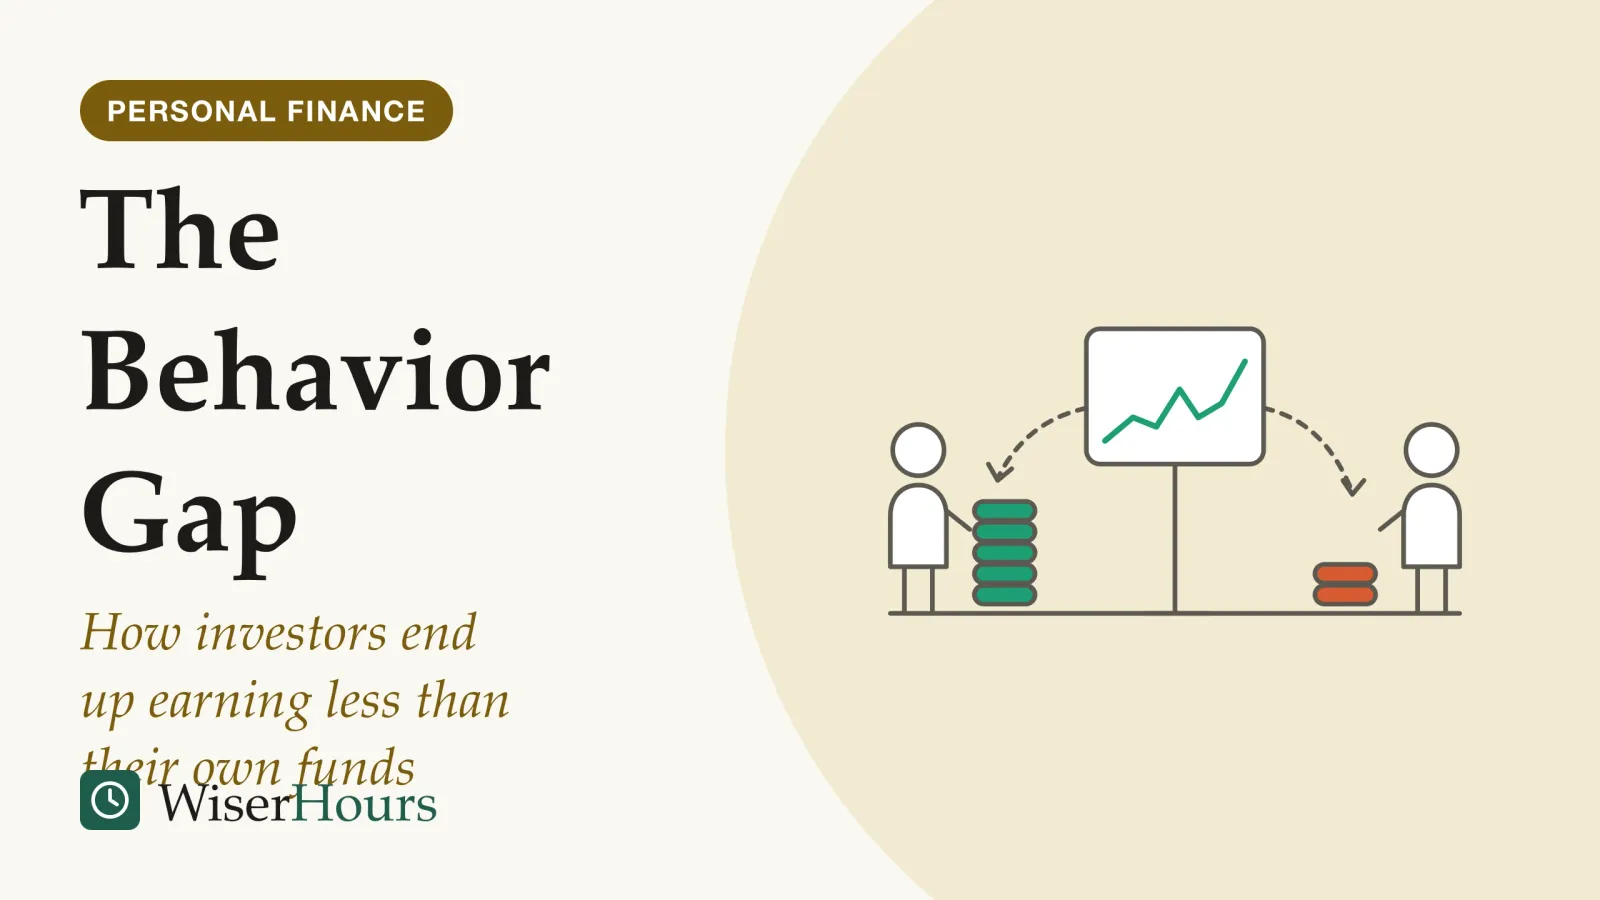
Owning a fund does not mean earning the fund’s return. A factsheet’s figure assumes one purchase held from the first day to the last, and hardly anyone invests like that: money goes in with each paycheck, comes out for a house deposit, and sometimes moves because the news turned. Each of those dates changes what your money earned.
The investor behavior gap is the difference between the two: the return a fund reports minus the return its investors actually earned once the timing and size of their deposits and withdrawals are counted. Studies agree that investors’ own returns tend to trail their funds’; they disagree sharply on how much of that is bad timing and how much is arithmetic. The evidence is mostly from US funds, so readers elsewhere should take the figures as a guide to how the gap works, not to its size in their own market.
The part that applies to your own money is short. Find the money-weighted return on your statement, if your provider shows one, set it beside the fund’s return for exactly the same dates, and count the trades you made that were not in your plan; the checklist near the end walks through it. The rest of this page explains one reason behind the common advice to beginners: investing regularly and leaving it alone: how the best-known estimates are built, why they disagree, and which part you control.
Two ways to count a return, and why they disagree
A fund’s published return is time-weighted: it shows what money invested at the start and held to the end would have earned, ignoring when anyone bought or sold. Your own return is dollar-weighted, also called money-weighted: an internal-rate-of-return calculation that gives more weight to the months when you had more money invested, as Morningstar explains in its annual study of the gap.1
The gap in one sentence
The behavior gap is the difference between a fund’s time-weighted total return and the dollar-weighted return its investors earned over the same period. A negative gap means the average invested dollar earned less than holding from start to finish would have.
The same percentage move lands on different amounts of money. If most of your money arrives just before a bad year, that year hits a large balance; if it arrives before a good year, the good year counts for more. The fund’s own return treats every month alike, because it follows one unchanging holding.
So a gap can open without a single bad decision. The drawing below works through an invented two-year example: a saver adds the same amount at the start of both years, and the only thing that changes is whether the good year or the bad year comes first. The fund reports the same return both times; the saver’s own result swings from a small loss to a healthy gain.
- One fund, either order: up 20% one year and down 10% the next reports about 3.9% a year, whichever year comes first
- Good year first: a saver who adds 1,000 (in any currency) at the start of each year ends with 1,980 from 2,000 paid in: about −0.7% a year
- Bad year first: the same saver, making the same deposits, ends with 2,280: about 9.1% a year
- Nothing but the calendar changed: more money was invested during the second year, so that year counted for more. An invented example; our arithmetic
The same pattern shows up in whole stock markets. Ilia Dichev’s 2007 paper in the American Economic Review used dollar-weighted returns to show that investors’ actual returns were systematically lower than buy-and-hold returns in nearly all major international stock markets.2 A later paper in the Journal of Financial and Quantitative Analysis, summarizing his results, puts the shortfall at about 1.3 percentage points a year for US stocks on the NYSE and AMEX from 1926 to 2002, and at about 1.5 points across 19 international stock exchanges from 1973 to 2004.3
So when your statement and the factsheet disagree, look at the dates before you blame yourself. Your figure describes your money; the fund’s describes a holding nobody may actually have had.
The investor behavior gap as Morningstar measures it
Morningstar’s annual Mind the Gap study is a regular estimate whose full method is published. It pools the assets and monthly cash flows of US mutual funds and ETFs, then compares the pool’s dollar-weighted return with its time-weighted return over ten years. It is commercial research by a fund-data company and is not peer reviewed.1
The study
Mixed evidence
What the average dollar earned in US funds, 2015 to 2024 (Morningstar, 2025)
The average dollar invested earned 7.0% a year before inflation, while the funds themselves returned 8.2% a year: a gap of about 1.2 percentage points a year, equal to around 15% of the funds’ total return. Gaps of similar size appeared in the 10-year periods ending in 2020, 2021, 2022 and 2023, and they were widest in funds whose cash flows swung the most.1
Read the method before the headline. The study measures the average dollar, not the average investor, and Morningstar says plainly that its figure is not a proxy for the average investor’s own return. It counts funds that merged or closed during the decade but leaves out every fund launched after the start date.1
it’s not advisable to view this study’s findings as a parable of “dumb money” or evidence of individual investors’ fallibility.
Outside the US the picture varies by market. Morningstar’s 2023 study of six other fund markets found negative gaps in all of them from mid-2018 to mid-2023, smallest in Australia and the United Kingdom, where it describes financial advice as more holistic, and largest in the cross-border fund hubs of Ireland and Luxembourg, where funds are often sold as stand-alone products.4 In its previous global study, the same report notes, investors in Australia and the UK had come out ahead of their funds.
A gap belongs to a market and a period as much as to its investors: a figure from one decade says little about the next, and a US figure little about a fund bought elsewhere.
Dalbar’s headline number and the case against it
Dalbar’s Quantitative Analysis of Investor Behavior, a report sold by a US financial-services research firm, produces the biggest and most quoted gap figures. For 2024 it put the average US equity fund investor’s return at about 16.5 percent, against about 25 percent for the S&P 500 index.5 For 2025 the same measure shrank to a gap of under 1 percentage point, the smallest since 2012 by Dalbar’s count.6
A measure of habits that swings from about a third of the market’s gain to almost nothing in a year invites caution. The full method is in a paid report, and at least one detailed critique calls the comparison lopsided. In 2012 the personal-finance blogger Harry Sit pointed out that Dalbar sets investors’ dollar-weighted returns against an index’s time-weighted return, so the order in which good and bad years arrive gets counted as investor behavior.7
Sit also noticed that in Dalbar’s own 2012 edition, its average equity fund investor had earned slightly more over the 20 years to 2011 than a hypothetical investor putting in a fixed amount every year. He argued that because Dalbar sells the study to financial advisers, it has an incentive to overstate how badly investors do on their own.7
When a behavior-gap statistic turns up in an adviser’s slides or a news story, ask three questions before you believe it: over what period, compared with what benchmark, and would a steady saver who never reacted have shown the same gap?
How much of the gap is really bad timing?
Less than the famous figures suggest, according to two peer-reviewed reanalyses. A 2014 paper by Simon Hayley of Cass Business School in London found that most of the dollar-weighted shortfall for mainstream US stocks was a hindsight effect rather than bad investor timing.3 A 2026 study in the Financial Analysts Journal found that poor timing cost the mutual fund investors in Morningstar’s US sample only about 0.1 percentage point a year.8
Hayley’s argument turns on when money moves. New money tends to follow past returns, arriving after markets have risen. That pattern drags the dollar-weighted figure down even though it does nothing to investors’ expected wealth; only flows that anticipate future returns reveal real timing skill, or its absence.3
Picture a saver whose bonus tends to be larger after a strong year and who invests it when it lands. Her dollar-weighted return can trail the fund’s, yet nothing about the decision was reckless: the money arrived when it arrived (an illustrative case).
Jon Fulkerson and colleagues went back to the same fund sample Morningstar used for its 2025 study and reached their much smaller estimate. Only their abstract was available to us, so the reasons for the difference are not covered here.8
- Myth
- The behavior gap proves most investors panic their way out of a large share of the market's return.
- Fact
- Part of any measured gap is arithmetic about when savings arrive. A 2026 peer-reviewed reanalysis finds the pure cost of bad timing for US fund investors as a group is small, and the question is still debated.
None of this makes timing mistakes harmless: selling after a fall and buying back after a recovery can still hurt one person’s result. It means the group averages are shaky, and yours can sit far above or below them.
| Study | What it measured | Finding | Evidence |
|---|---|---|---|
| Dichev, 2007 | Dollar-weighted vs buy-and-hold returns of whole markets | Investors’ returns lower than buy-and-hold in nearly all major international markets | Observational, peer reviewed; abstract read2 |
| Hayley, 2014 | The same US data, split into timing and hindsight | Most of the US shortfall was a hindsight effect; bad timing had very little impact | Observational, peer reviewed3 |
| Morningstar global, 2023 | Fund flows in six markets, mid-2018 to mid-2023 | Negative gaps in all six; smallest in Australia and the UK (about 0.3-0.4 points a year) | Observational, commercial4 |
| Dalbar QAIB, 2026 | Average US equity fund investor vs the S&P 500 in 2025 | Gap under 1 point, the smallest since 2012 | Commercial; full method in a paid report6 |
| Fulkerson and colleagues, 2026 | Morningstar’s own 2025 US sample | Poor timing cost about 0.1 point a year | Observational, peer reviewed; abstract read8 |
Trading is where the cost is clearest
The firmest evidence of investors costing themselves money concerns trading, not the timing of fund flows. In the records of about 66,000 US households at one discount broker between 1991 and 1996, Brad Barber and Terrance Odean found that the fifth who traded most averaged 11.4 percent a year once costs were paid (before inflation), while the fifth who traded least averaged 18.5 percent.9 Put simply, the busiest traders’ yearly return was more than a third lower than the quietest traders’.
Before costs, frequent and infrequent traders earned much the same, so commissions and the gap between buying and selling prices made the difference. The authors argue that overconfidenceoverconfidence: Being more sure of your knowledge, skill or forecasts than the results justify, for example rating yourself above average or giving too narrow a range for an estimate. It is broader than the Dunning-Kruger effect, which is about how the error varies with skill.Full entry in the glossary can explain why people trade so much.9 The caveats matter: one broker, individual shares rather than funds, and a strong US market in the 1990s, so the figures describe that group, not today’s investors.
Someone who swaps one holding for another every few weeks pays a small toll each time; in Barber and Odean’s data, those tolls, not worse choices of shares, separated the busiest traders from the quietest.
Morningstar’s fund data point the same way. Its 2025 study found the widest gaps in funds with the most volatile cash flows, which it treats as a sign of heavy trading, and it concludes that if anything predicts poor dollar-weighted returns, it is trading activity.1 Other habits feed the same pattern; the pull to sell winners and cling to losers is covered in the disposition effect and why investors hold on to losing investments.
Where gaps were smaller, and what that suggests
The evidence on narrowing the gap is observational: it shows where gaps were smaller, not what would shrink yours. In Morningstar’s 2025 US data, allocation funds, which hold a mix of assets and rebalance on their own, had the narrowest gaps, and the most popular fund categories had narrow-to-moderate ones, which Morningstar links to steady use inside retirement plans.1
Whether index fundsindex fund: A mutual fund or exchange-traded fund that aims to track a market index by holding the securities in it, or a sample of them. Tracking an index does not protect against losses, and funds tracking the same index can charge very different fees.Full entry in the glossary help is contested. The 2025 US study found active and index funds had roughly comparable gaps and warns against assuming indexing brings better dollar-weighted results.1 The 2023 global study found narrower gaps in index products than in their active counterparts.4 Neither finding is a reason to choose a particular fund, and this page recommends none.
What carries over is a way of working. A saver whose statement trails the factsheet checks two things before switching funds: whether her deposits bunched just before a fall, and whether she made trades she had not planned. The first is the calendar; only the second is behavior worth working on.
Checking your own gap
Before acting on a gap you have found
Research on the behavior gap cannot weigh your taxes, your goals or the rest of your money, so decisions that turn on those deserve personal advice, sooner in some situations than others.
- Now, if anyone urges you to move money fast or to switch into a product they sell: pause and look them up on your own national financial regulator’s register. For US investors, the Securities and Exchange Commission’s Investor.gov site says, as of 2026, to always check a financial professional’s background to confirm a license.10 For the UK, the Financial Conduct Authority’s guidance, updated in September 2026, sets out how to check a firm, since nearly every firm providing financial services there needs its authorisation or registration.11
- Soon, before a large switch or a sale that could trigger tax: a regulated adviser or tax professional can work through your own numbers. Ask at the start what they charge and who else pays them.
- Routinely, once a year: set your own return beside your funds’ returns for the same dates, and review which trades you made and why.
The bottom line
Your return and your fund’s return measure different things, and the difference comes partly from when your money arrived, not only from what you did with it. The large gap figures are the least reliable, and a 2026 peer-reviewed reanalysis of US fund data found the pure cost of bad timing for fund investors as a group to be small. The clearest cost is frequent, unplanned trading, and that is the part you control.
This article is general education, not financial advice. For decisions about your own money, speak to a qualified, regulated adviser.
Frequently asked questions
Is the behavior gap the same as paying fees?
No. In Morningstar's Mind the Gap studies, the fund return that investors are compared with is already calculated after the fund's own fees. The gap measures something else: how the timing and size of investors' purchases and sales changed what the average invested dollar earned. Platform, adviser and trading charges outside the fund are separate costs again.
Can investors earn more than their funds?
Yes, and at times whole markets have. Morningstar's 2023 study of fund markets outside the US reports that in its previous global study, investors in Australia and the United Kingdom gained from the timing of their flows, before the gap turned negative in both over mid-2018 to mid-2023. A positive gap, like a negative one, depends partly on the order of good and bad years.
Do workplace and automatic plans have smaller gaps?
They may. Morningstar's 2025 US study found narrow-to-moderate gaps in the most popular fund categories and suggests one likely reason is that big funds in them are held inside target-date funds or offered on retirement plan menus, where money arrives steadily. That is Morningstar's interpretation of an association, not a tested cause, and it is based on US funds only.
Sources
- Mind the Gap 2025: The more investors traded, the less they made. Ptak, J. et al. (2025). Morningstar, Inc., Portfolio and Planning Research, 13 August 2025; commercial research, not peer reviewed
- What Are Stock Investors' Actual Historical Returns? Evidence from Dollar-Weighted Returns. Dichev, I. D. (2007). American Economic Review, 97(1), 386-401
- Hindsight Effects in Dollar-Weighted Returns. Hayley, S. (2014). Journal of Financial and Quantitative Analysis, 49(1), 249-269
- Mind the Gap 2023: Investor Returns Around the World. Möttölä, M. et al. (2023). Morningstar Manager Research, 4 October 2023; commercial research, not peer reviewed
- Investors Missed the Best of 2024's Market Gains, Latest DALBAR Investor Behavior Report Finds. DALBAR, Inc. (2025). Press release, 31 March 2025, on the Quantitative Analysis of Investor Behavior (QAIB)
- DALBAR's 2026 QAIB Report Shows Narrower Investor Gap Amid a Complex and Volatile Market Year. DALBAR, Inc. (2026). Press release, 16 April 2026
- Does The DALBAR Study Grossly Overstate The Behavior Gap? (Guest Post). Sit, H. (2012). Guest post on Michael Kitces's Nerd's Eye View blog, 3 October 2012; practitioner commentary, not peer reviewed
- Bad Timing Does Not Cost Investors 15% of Their Funds' Returns: An Examination of Morningstar's "Mind the Gap" Study. Fulkerson, J. A., Jordan, B. D., Riley, T. B. & Yan, Q. (2026). Financial Analysts Journal, 82(3), 34-42
- Trading Is Hazardous to Your Wealth: The Common Stock Investment Performance of Individual Investors. Barber, B. M. & Odean, T. (2000). The Journal of Finance, 55(2), 773-806
- Check Out Your Investment Professional. US Securities and Exchange Commission, Investor.gov, accessed 2026-09-27
- How to check a firm or individual is authorised. Financial Conduct Authority (UK), first published 20 March 2023, last updated 22 September 2026
How we researched this
This review draws on the full text, read in September 2026, of Morningstar's 2025 US and 2023 global Mind the Gap reports, Dalbar's 2025 and 2026 press releases, peer-reviewed papers found through Crossref and OpenAlex (Barber and Odean 2000; Hayley 2014, accepted manuscript) and a 2012 practitioner critique. For Dichev (2007) and Fulkerson and colleagues (2026) only the abstracts were read. Main limitation: most data cover US funds, and gap estimates depend on the period and method.
Keep reading
Bear Markets Explained: What They Are and How Long They've Lasted Historically
A bear market is usually a fall of 20% or more, a convention rather than a rule. US bear markets since 1929 fell for 1 month to about 2.5 years.
Dollar-Cost Averaging vs. Lump Sum: What the Research Says
Dollar-cost averaging vs lump sum: why investing each paycheck is a different question, and what Vanguard and research since 1979 found about windfalls.
Diversification Explained: Why Spreading Your Money Reduces Risk
Diversification explained: why spreading cuts one company's risk but not the market's, and why one US study found the stocks needed rose from about 20 to 50.
What Is an Index Fund? How Tracking a Market Index Works
An index fund copies a market index instead of trying to beat it. How tracking works, why the copy is never exact, and 5 questions to ask before you buy.