The RACI Matrix Explained: A Step-by-Step Guide With Examples
A RACI matrix shows who does, owns, advises on and hears about each task. How to build one in 6 steps, with examples and what the evidence says.

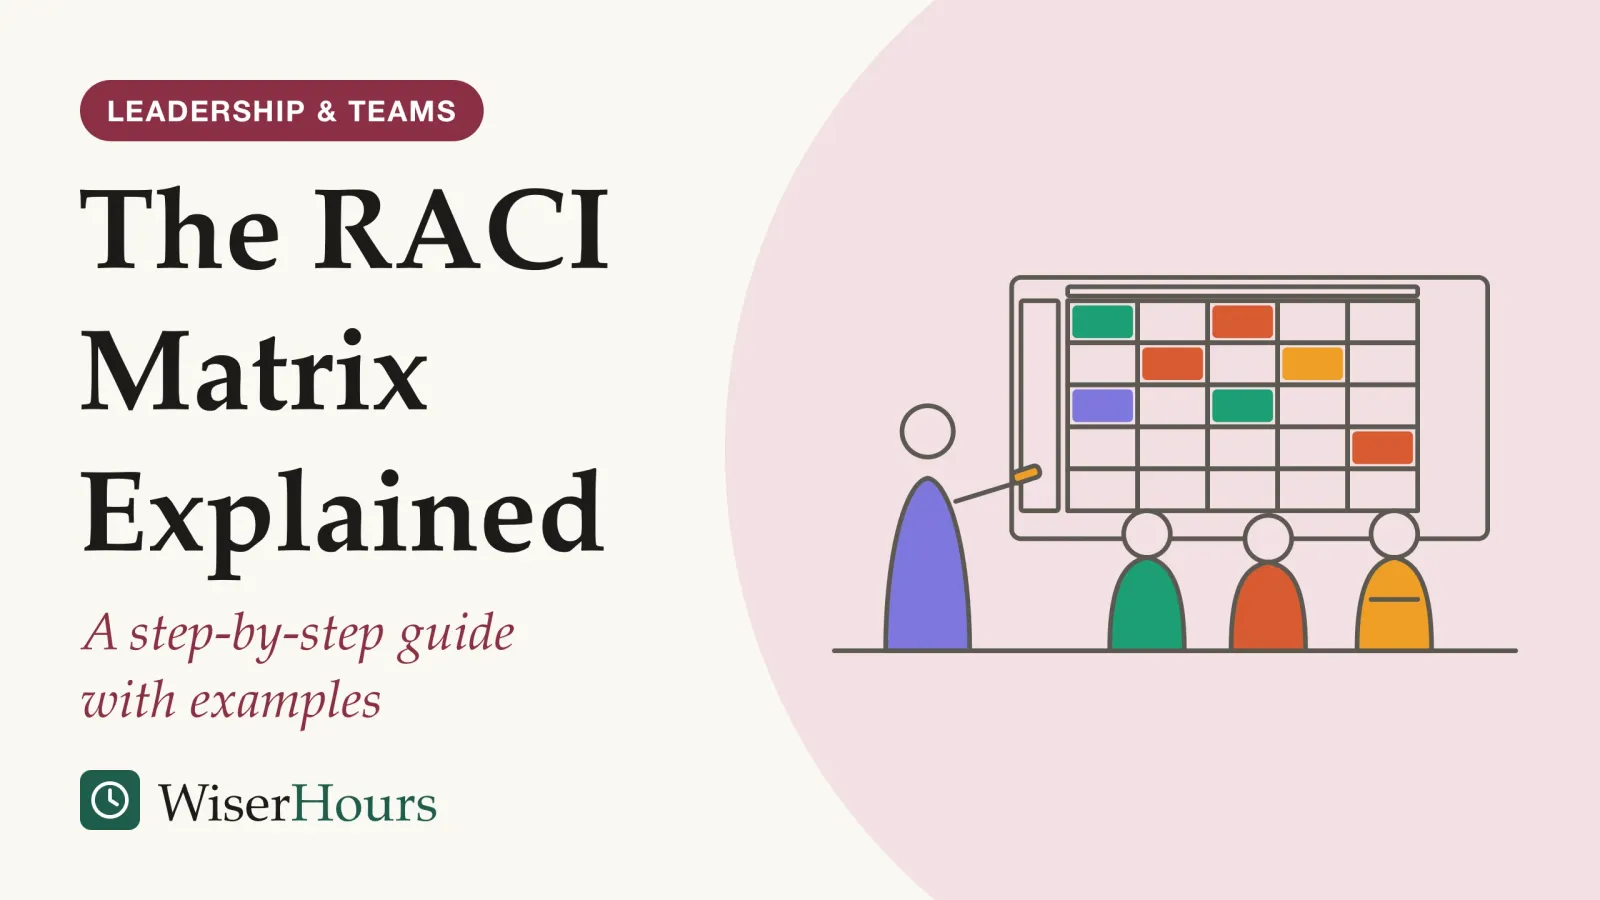
A RACI matrix is a table that shows, for every task or decision in a piece of work, who does it, who owns the result, who must be asked first and who simply needs to hear about it. Tasks run down the side, people run across the top, and each box holds one of four letters: R for Responsible, A for Accountable, C for Consulted and I for Informed. Building one takes six steps:
- List the deliverables and decisions.
- List the people or roles who touch them.
- Give every row one Accountable person.
- Add who does the work, then who to ask and who to tell.
- Read the finished chart down and across.
- Agree it together and keep it current.
It tackles a problem that research into what makes a team effective keeps returning to: capable people who are unsure what is theirs. We found no controlled study that tests the RACI matrix itself; the case for it rests on research, pooled in a 1985 meta-analysismeta-analysis: A study that combines the results of earlier studies on the same question into one overall estimate. Pooling makes the estimate more precise, but it cannot repair the studies it pools: a meta-analysis of surveys is still survey evidence.Full entry in the glossary of 96 articles, linking unclear roles to lower job satisfaction and, more weakly, to lower performance.1
A RACI matrix example, filled in
The quickest way to understand a RACI matrix is to see a finished one. This one is invented for illustration: a three-person marketing team that sends a monthly customer newsletter with help from legal and sales.
In this made-up story, the writer assumed legal had checked the discount offer, legal assumed nobody would send an offer without asking, and the email went out with a code that had expired. Nobody was careless; nobody had been named. Here is the chart the team drew up afterwards:
| Task | Team lead | Writer | Designer | Legal | Sales |
|---|---|---|---|---|---|
| Choose the issue’s theme | A | R | C | C | |
| Write the draft | I | A/R | C | ||
| Check claims and offers | I | R | A | ||
| Lay out and test the email | I | C | A/R | ||
| Approve and send | A/R | I | I | I | |
| Report results | A | R | I |
Read it and you can already answer the questions that usually cost a meeting: who decides the theme (the team lead), whether sales must see the draft (no, only the theme and the results), and who can stop an offer going out (legal). Two choices are deliberate. Legal owns only the offers row, which gives them a veto where it matters without making them approve every sentence. And the writer both writes and owns the draft (A/R), because on a small task splitting the letters would only add a handoff.
What this means for you: if a question about your own work cannot be answered from a chart like this in a few seconds, that question is the row to add.
What R, A, C and I stand for in practice
The four letters separate kinds of involvement that everyday speech blurs together. In the definitions a US Department of Health and Human Services team published in 2020, Responsible people do the work, the Accountable person owns it and signs it off, Consulted people give input before it is finished, and Informed people are kept up to date without contributing.2
Definition
A RACI matrix is a table of tasks and people in which each box says whether that person does the task (Responsible), owns and signs it off (Accountable), gives input first (Consulted) or is kept updated (Informed).
The difference between the last two letters is where the time goes. Consulting is a two-way conversation that has to happen before the work can be signed off, so every C is a small dependency. Informing is one-way: a message, a copy on an email, an invitation to a review. Several people can share the R, but only one person holds the A.2
In the newsletter chart, sales is a C on the theme, where customer knowledge changes the answer, and only an I on the send, where it does not.
Charts like this are not new. A 1988 paper in Management Decision, under the name “linear responsibility charting”, described the technique as an aid to complex decisions when responsibility is shared among a group.3 The lesson for filling one in today is a simple test for every C: would the work change if this person said no? If not, they are an I.
Why a RACI matrix gives each task only one Accountable person
A single name in the A column keeps ownership from dissolving into the group. Research on group effort suggests people ease off when their own contribution cannot be evaluated, and a shared “we own this” is exactly that situation.
The evidence comes from a 1993 meta-analysis of 78 studies by Steven Karau and Kipling Williams, which found that people working collectively tend to exert less effort than when working alone, across tasks and populations. Among the conditions that shaped the effect, the chance that an individual’s contribution would be evaluated had an especially strong influence.4 That is a finding about group effort in general, not about charts: it explains why a single owner makes sense rather than proving that one works.
In ordinary work it looks like an email thread with five people copied and a client waiting. Everyone reads it, everyone assumes someone else will reply, and nobody does. Two co-owners produce a milder version of the same thing: each can reasonably believe the other is handling it.
Success requires making only one person Accountable, which means that “the buck stops there.”
The same guidance gives the Accountable person a job beyond signing off: to act as the “decider”, collecting input from the people who need to be heard and making the call when that input does not arrive in time.2 That turns the A from a title into a way of breaking deadlocks.
- Myth
- Making two people accountable doubles the attention a task gets.
- Fact
- Ownership does not add up that way. With two owners each can assume the other has it; give the row one A and let the other person be R or C.
The practical lesson: when two people both claim the A, the task is usually two tasks. Split the row, for example “choose the vendor” and “negotiate the contract”, and give each its own owner.
Does a RACI matrix work? The evidence is indirect
We found no controlled trial of RACI charts. The strongest evidence behind them is indirect: meta-analyses of workplace surveys that link role ambiguity, not knowing what is expected of you, to worse outcomes. That makes RACI a sensible, cheap tool, not a proven performance booster.
The study
Moderate evidence
Unclear roles at work: 96 articles pooled in 1985
Susan Jackson and Randall Schuler pooled the published research on role ambiguity at work. People who reported more ambiguity about their role reported lower job satisfaction and commitment and a greater wish to leave. Performance showed only a weak association, weakest where it was measured objectively.1
The satisfaction findings are the sturdier part. Most of the studies were cross-sectionalcross-sectional: Describes a study that measures everyone in its sample at a single point in time. Because the possible cause and the outcome are recorded together, it can show that two things occur together but not which of them came first.Full entry in the glossary, taking all their measures at a single point, so the authors warned that cause cannot be read off them; they also noted an experiment suggesting that people who think they performed poorly are more likely to call their situation ambiguous.1 A 2000 update by Travis Tubre and Judith Collins, using a larger database, found a modest negative correlationcorrelation: A measure of how closely two things move together, running from minus one, where one rises as the other falls, through zero, meaning no link, to plus one. It says how strong the relationship is, not what causes it, and it is not a percentage.Full entry in the glossary between role ambiguity and performance, about minus 0.2, which varied by type of job and by who rated performance.5 Modest means noticeable across many people and easy to miss in any one of them.
Two other lines of work point the same way without testing RACI. A 2009 meta-analysis of team-building studies examined role clarification as one of four components, with goal setting, interpersonal relations and problem solving, and reported a moderate positive effect of team building overall.6 Google’s re:Work team-effectiveness guide likewise tells managers to clarify team members’ roles and responsibilities, a tip drawn from outside research and Google’s own experience.7
The closest thing to a direct report on RACI comes from Wake Forest School of Medicine, where business-school faculty taught research teams to use the chart. Project managers on two teams said it helped balance workload and worked as an onboarding tool for new members; the authors describe this as early, self-assessed feedback and plan performance-based evaluation.8
So judge a chart by whether people stop asking whose job something is, not by a jump in output the evidence cannot promise.
How to build a RACI matrix step by step
Building a RACI matrix takes six steps that expand the sequence the Wake Forest team teaches: list the tasks, decide the owner of each row, fill in the other letters, then check the whole chart.8 Each step below shows how it played out in the newsletter chart.
- 1Rowsdeliverables and decisions
- 2Columnspeople or roles
- 3One A per rowthe owner who signs off
- 4R, then C and Iwho does, who is asked, who is told
- 5Read and agreedown, across, then with the team
1. List the deliverables and decisions
Write each row as a verb and a thing: “approve the budget”, “brief the agency”, “choose the vendor”. Include decisions as well as tasks. Part of the HHS team’s case for a chart was that decisions often had to be made quickly and with incomplete input, so it helped to settle in advance who made them.2
Keep rows at the level where work changes hands; a row per keystroke buries the handoffs you are trying to see. The newsletter needed only six rows, and “check claims and offers” earned its own because it was the handoff that had failed.
2. List the people or roles who touch them
Put everyone who does, approves, advises on or needs to know about the work across the top, including people outside the team, as legal and sales are in the newsletter chart. Use names for a one-off project and roles for a process that repeats while people come and go.
3. Give every row one Accountable person
Decide the A before anything else. In the Wake Forest method, the team settles who is Accountable for each task first and gives only one person that letter, to avoid confusion.8 Pick someone who can sign the work off and who understands the stakeholders and goals: the HHS guidance wants the owner to know what each party cares about, so they can make good trade-offs under pressure.2 In the example, legal owns the offers check even though the writer does the checking, because the person who can say no should be the one who signs off.
4. Add who does the work, then who to ask and who to tell
Mark the R’s next, then the C’s, then the I’s. Be stingy with C. Every C adds someone whose input has to arrive before the work can finish, and a row with four C’s is a row that will wait. If someone only needs the outcome, they are an I. The newsletter’s designer is consulted on the theme and the draft but has no letter on the results report, since nothing in it waits on them.
5. Read the finished chart down and across
Read down each column to see a person’s load, and across each row to check the task. The Wake Forest authors describe scanning columns to spot someone stretched across too many tasks, or underused, and scanning rows to spot tasks that are under-resourced; an overloaded person can have an R downgraded to a C.8 Try it on the example: the writer holds an R on four of the six rows, a load worth discussing before a busy month rather than during one.
- Down a column: how much one person carries
- Across a row: one A, someone doing the work, few voices
Across a row, look for no A or more than one, no R at all (an owner with nobody doing the work), or a crowd of C’s. Down a column, an A or R on nearly every row is a bottleneck in waiting; a column of only I’s may belong off the distribution list.
6. Agree it together and keep it current
Share the draft with everyone on it and ask whether they recognize their letters. HHS advises drafting and sharing the chart during planning and adjusting it as roles and responsibilities evolve, which can also expose staffing gaps early.2 The Wake Forest teams treated the chart as a living document, changed as the work went on.8 For a team like the newsletter’s, that can be ten minutes in a planning meeting that already exists, plus another look whenever someone joins or leaves; why meetings fail explains how to keep such slots from sprawling.
Before you share your RACI matrix
When a RACI chart is worth the effort
A RACI chart earns its keep when several people or teams touch the same work and the handoffs are where things get dropped. The HHS team reached for one because, as the number of stakeholders in a program evaluation grows, knowing who is responsible for what gets hard.2 A two-person task, or a routine everyone already knows, does not need one.
The chart also has limits. It records agreements; it does not create authority or commitment. If the person in the A column cannot actually decide, the letter is decoration, and the real owner is whoever people go to anyway. The Wake Forest authors paired the chart with a team charter, which sets purpose and shared expectations first, and judged the two most effective together, though that is their view rather than a tested result.8
In ordinary work, the best use is often the first draft. A product team that fills in the chart and finds, say, three people claiming the launch decision has learned something no status meeting surfaced. For the wider planning a chart sits inside, see what project management involves.
The bottom line
A RACI matrix is a one-page answer to “whose is this?” Build it owners first: one Accountable person per row, then the doers, then as few people to consult as the work allows. We found no controlled trial of it, but unclear roles have a long record of going with unhappier, and somewhat less effective, people. The chart is cheap, and the argument it starts is usually the useful part.
Frequently asked questions
Can one person be both responsible and accountable in a RACI matrix?
Yes. On small tasks the owner often does the work too, and a 2020 example chart from the US Department of Health and Human Services marks some rows A/R. What matters is that each task still has only one Accountable person, and that the owner is not quietly doing every row alone.
Should a RACI matrix use people's names or job titles?
Either works, as long as every column points to someone who can be asked. A 2020 example chart from Wake Forest researchers used first names, while the HHS example used roles such as team lead and analyst. Names suit a single project; roles suit a process that repeats while people change, as long as each role maps to one person at a time.
How often should a RACI matrix be updated?
Whenever roles change, rather than on a fixed schedule. The US Department of Health and Human Services advises drafting the chart during planning and adjusting it as roles and responsibilities evolve, and Wake Forest researchers describe theirs as a living document that the team changes and adds to while it works; project managers there found it useful for bringing new members up to speed.
Is a RACI matrix only for project management?
No. It is usually described as a project management tool, but the published examples come from elsewhere too: HHS used one to run a program evaluation with schools and community groups, and Wake Forest School of Medicine taught research teams to use one alongside a team charter. Any recurring work that several people touch can be charted the same way.
Sources
- A meta-analysis and conceptual critique of research on role ambiguity and role conflict in work settings. Jackson, S. E. & Schuler, R. S. (1985). Organizational Behavior and Human Decision Processes, 36(1)
- Lessons Learned: The RACI Diagram Tool. Office of Population Affairs, US Department of Health and Human Services (2020). Sexual Risk Avoidance Program Evaluation
- Linear Responsibility Charting: A Technique for Strategic Management. Korey, G. (1988). Management Decision, 26(6)
- Social loafing: A meta-analytic review and theoretical integration. Karau, S. J. & Williams, K. D. (1993). Journal of Personality and Social Psychology, 65(4)
- Jackson and Schuler (1985) Revisited: A Meta-Analysis of the Relationships Between Role Ambiguity, Role Conflict, and Job Performance. Tubre, T. C. & Collins, J. M. (2000). Journal of Management, 26(1)
- Does Team Building Work? Klein, C., DiazGranados, D., Salas, E., Le, H., Burke, C. S., Lyons, R. & Goodwin, G. F. (2009). Small Group Research, 40(2)
- Guide: Understand team effectiveness. re:Work Editorial Team, Google (2015). re:Work
- Creating effective academic research teams: Two tools borrowed from business practice. Brower, H. H., Nicklas, B. J., Nader, M. A., Trost, L. M. & Miller, D. P. (2020). Journal of Clinical and Translational Science, 5(1), e74
How we researched this
Sources for this guide came from September 2026 searches of PubMed, OpenAlex, Crossref and the general web for evaluations of RACI and responsibility charting, and for meta-analyses on role ambiguity, role clarification and group effort. PubMed held no controlled evaluation of RACI itself, so the article pairs practitioner sources with indirect evidence. Sources date from 1985 to 2020; three were read only as abstracts.
Keep reading
Tuckman's Stages of Team Development: Forming, Storming, Norming, Performing
Forming, storming, norming, performing and adjourning: where Tuckman's 1965 stages of team development came from, and how to use them at work.
What Is the Ideal Team Size? What the Research Says
There is no single ideal team size: a 2023 review of 208 team results found no overall link. Here is when size matters more, when it matters less, and why.
What Makes a Team Effective? What Decades of Research Show
What makes a team effective? Decades of research point less to star talent than to how a team is set up and works together. Here is the evidence.