How to Use a Decision Matrix: Comparing Options With Weighted Criteria
How to build a decision matrix in 6 steps: pick criteria that don't overlap, score one column at a time, weight the gaps, then test the winner.

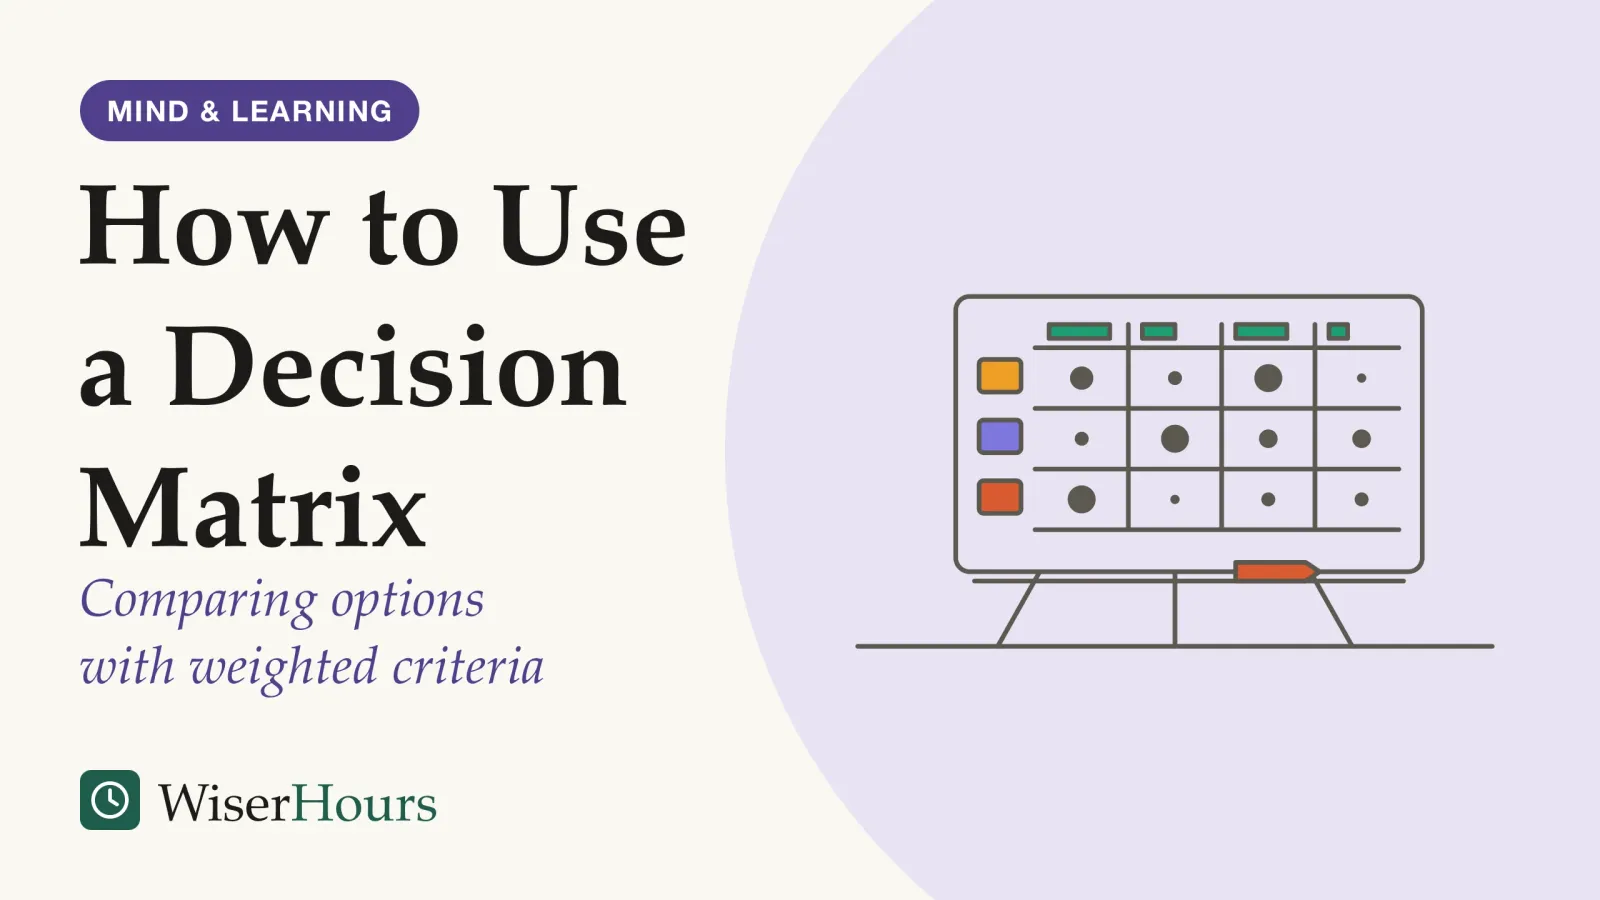
A four-person team has spent two meetings on one question: which of three project-management tools to buy. Each person has a favorite, each favorite wins on a different feature, and the discussion keeps drifting toward whoever spoke last.
A decision matrix ends that drift by putting the weighing on paper: options down the side, criteria across the top, a weight for each criterion and a score in every cell, so each option gets a total you can inspect and argue with. Building a good one takes six steps:
- Shortlist the options that pass every must-have
- Choose a few criteria that do not overlap
- Score one criterion at a time, across all options
- Weight what the difference between options is worth
- Multiply, add and test how easily the winner changes
- Hold the result up against your gut
Doing the arithmetic pays. When data on job applicants were combined by a formula rather than by holistic judgment, predictions of job performance were more than 50 percent better in the authors’ terms, a 2013 meta-analysismeta-analysis: A study that combines the results of earlier studies on the same question into one overall estimate. Pooling makes the estimate more precise, but it cannot repair the studies it pools: a meta-analysis of surveys is still survey evidence.Full entry in the glossary in the Journal of Applied Psychology found. The gain is in how closely predictions tracked later performance, and it held even when the people judging were experts who knew the jobs and often had more information.1 A decision matrix is a formula of the same kind, built for choosing rather than predicting, and it puts a written structure on the fast and slow thinking described in how people make decisions.
What goes in a decision matrix: facts in the cells, values in the weights
A decision matrix is a table that rates each option against the same criteria and combines the ratings using weights. The UK government’s 2009 manual on multi-criteria analysis calls the table a performance matrix and the combining rule a linear additive model: multiply each score by its criterion’s weight, then add the results for each option.2
The arithmetic matters less than the separation it forces. Most arguments about options blend two questions, what matters and how each option performs, and the blend turns into a contest between favorites.
A 1974 dispute in Denver shows the difference. The police wanted a new handgun bullet, critics said it caused far more injury, and both sides enlisted ballistics experts. The researchers Hammond and Adelman split the questions: policymakers named what a bullet should do (stop an attacker, avoid serious injury, avoid harming bystanders), and ballistics experts rated candidate bullets on those dimensions, weighted equally because the policymakers could not agree. The result identified a bullet that stopped better and injured less than the one in use, and the city council accepted it, as the psychologist Robyn Dawes recounted in 1979.3
In your own matrix, keep those two jobs apart. Scores record facts about each option, weights record what you value, and the person who knows the facts need not set the weights. On the tool team, the colleague who ran the trials can score ease of use, while everyone argues about how much ease of use is worth.
A weighted sum lets a strong score on one criterion make up for a weak one elsewhere, which suits trade-offs and fails for dealbreakers. The UK manual’s remedy is a minimum acceptable level: options that fall below it are rejected outright, because no other strength can compensate.2 A tool that fails your security requirement should never reach the totals, however cheap it is.
Further reading
Smart Choices: A Practical Guide to Making Better Life Decisions
A practical guide to structured choices: naming objectives, comparing options on the same criteria and making trade-offs explicit.

As an Amazon Associate WiserHours earns from qualifying purchases.
How to build a decision matrix in six steps
The steps below follow the order of the UK manual’s own eight steps: options first, then criteria, scores, weights, the combined total and a final sensitivity check.2 The worked example uses the team choosing a project-management tool, with made-up scores for illustration.
1. Shortlist the options that pass every must-have
Drop anything that fails a hard requirement before you build the table, using the minimum-level rule above, so the matrix chooses among options you could genuinely live with.
2. Choose a few criteria that do not overlap
The UK manual asks three questions of any set of criteria: have we left out anything important, is any criterion unnecessary, and is the same effect being recorded under two names? Double counting, it warns, gives an effect more weight than it deserves. It also offers a test for whether a weighted sum will work at all: can you score an option on one criterion without knowing its scores on the others?2
Overlap creeps in through detail. In a 1988 experiment on weighting, the parts of a decision spelled out in more detailed sub-criteria received significantly more weight than parts described in less detail, a bias the authors traced to the extra attention that detail attracts (we read only the abstract).4 If “cost” becomes licence fee, training cost and setup cost, it can quietly outweigh everything else. Group sub-criteria under one heading before you weight.
3. Score one criterion at a time, across all options
Fill the table column by column, not row by row, using one scale for every criterion (1 to 5 works) and writing down what a low, middle and high score look like before you start. The reason is the halo effect, one of the systematic errors of judgment known as cognitive biases. In a 1977 experiment, 118 students watched the same lecturer behave either warmly or coldly; those who saw him warm rated his appearance, mannerisms and accent as appealing, and those who saw him cold rated the same features as irritating. The students did not realize their overall liking had shaped those ratings.5
Scoring one option at a time invites the same slide: once a tool feels like the winner, its weaker features start to look better. Scoring one criterion across all options keeps each comparison narrow.
4. Weight what the difference between options is worth
Weight each criterion by how much the gap between the best and worst option on it matters to you, not by how important the topic sounds. The UK manual calls this swing weighting and gives a car-buying example: price may matter a great deal in general, but if every car on your shortlist costs about the same, price deserves little weight in this particular choice.2
For the team, every shortlisted tool already meets its security needs, so security earns little weight here even though it matters enormously in general. The real differences are in price, ease of use and integrations. Weighting after scoring also helps: you can see how far apart the options really are before deciding how much that gap is worth.
5. Multiply, add and test how easily the winner changes
Multiply each score by its weight and add across the row. Then change the weights you were least sure of and see whether the order holds. The UK manual recommends exactly this kind of sensitivity check, and notes that when the best options stay close under different weightings, accepting the second-best one costs little.2
Try it: swap price and ease of use to 30 and 40.
Weight-swap sandbox
The team's three tools, with made-up scores for illustration. Only the weights change.
Weights need not add up to 100: only how they compare matters.
| Tool (illustrative) | Price, weight 40 | Ease of use, weight 30 | Integrations, weight 20 | Support, weight 10 | Total |
|---|---|---|---|---|---|
| Tool A | 4 | 3 | 5 | 2 | 370 |
| Tool B | 2 | 5 | 4 | 4 | 350 |
| Tool C | 5 | 2 | 3 | 3 | 350 |
Tool A ranks first at the starting weights, 20 points ahead of Tools B and C.
A total is an argument, not a verdict. If a small change of weights flips the leader, the options are close. Then, as step 6 suggests, hold the result up against your gut and look for a missing criterion.
Tool A wins by a nose, but swapping two weights the team argued about hands the lead to Tool B (A falls to 360). That is the useful result: A and B are close, and the choice turns on one question, whether price or ease of use matters more to this team.
- Weighted scores: each segment is one criterion: the option’s score multiplied by that criterion’s weight
- A close finish: when totals end this near each other, a plausible change in the weights can swap their order; a sensitivity check shows whether it does
- Must-haves first: an option that falls below a minimum acceptable level is dropped before scoring, because no other strength can make up for it
6. Hold the result up against your gut
If the winner feels wrong, neither overrule the matrix nor obey it: find out why. The UK manual advises using intuition throughout and exploring any gap between the model and gut feeling, because sometimes intuition is wrong and sometimes the model needs revising.2
If you catch yourself nudging weights until a favorite wins, the real reason for the preference is probably not in the table yet: name it and add it as a criterion.
Is the matrix ready to decide?
Does a written formula beat weighing options in your head?
For combining information, usually yes. A 2000 meta-analysis of prediction in health and behavior found that fixed rules matched or beat human judges in most studies that gave both the same information.6
Reviews of this research put the weak link in the combining, not the collecting: people are good at gathering information about options and much less reliable at weighing it all together.1 Weigh five factors in your head for three options and the weights drift: the factor you considered last, or the one with a vivid story attached, counts for more on Tuesday than on Monday. Grove and colleagues point to these habits, poor weighting of cues and overweighting of vivid data, plus the rarity of clear feedback.6
The study
Moderate evidence
When clinicians and formulas got the same facts
William Grove and four colleagues at the University of Minnesota pooled studies in which human judges and a mechanical rule predicted the same outcome from the same information. On average, the rules were about 10 percent more accurate. Depending on the analysis, the rule was clearly better in 33 to 47 percent of studies and the judges in only 6 to 16 percent. The pattern held for experienced and inexperienced judges alike, and the rules’ advantage grew when judges also had an interview to draw on.6
Part of a rule’s edge is plain consistency: it gives the same answer to the same information every time. The caveat: these were predictions of outcomes such as diagnoses and academic success, many rules were fitted to statistical data, and none of the studies tested a matrix built for a personal choice. We found no trial that has.
You don’t need statistically perfect weights to get that benefit, Robyn Dawes argued in 1979. Reviewing the evidence, he found that even improper linear models, with weights set by intuition or simply made equal, predicted better than the clinical judges they were compared with, and equal weights did especially well. When every criterion points the right way, quite different weights tend to rank options in much the same order. His one condition matters for a homemade matrix: put the criteria on a common scale first.3
the whole trick is to know what variables to look at and then know how to add
In practice, put your effort into choosing criteria and scoring honestly, not into polishing weights. When a small change of weights flips the order, as it did for Tools A and B, the options are close, and more decimal places will not settle it.
When scoring every detail makes the choice worse
More analysis is not always better. In a 1991 experiment, students choosing college courses who were asked to rate every piece of information about every course came to treat the information as more equally important, and they were less likely than students given no special instructions to sign up for the courses that past students had rated highly.7
In the same paper, students asked to analyze why they liked various strawberry jams ended up agreeing less with trained tasters than students who just tasted them.7 Both studies used undergraduates and choices partly about taste. In a 1999 course-choice study by other researchers, students asked to reflect on their decision also separated important from unimportant information less well (we read only the abstract).8 Treat the findings as a caution rather than a verdict. The caution fits the steps above: a matrix helps most with a few criteria chosen in advance and weighted on purpose, and least when every detail gets a row and an equal vote.
- Myth
- The more criteria a decision matrix includes, the more reliable its answer.
- Fact
- Rating every attribute of every option made students weigh the information more evenly and choose well-rated courses less often in a 1991 experiment. A few deliberate criteria can beat an exhaustive list.
For a choice that is mostly about taste, like which sofa looks right in your living room, a matrix may add little. Keep it for choices where the criteria can be named and the options compared on facts.
How much weight the evidence itself can bear
The best support for decision matrices is indirect: fixed rules combine information more consistently than people do. Advice on weighting and scoring rests on smaller experiments and government guidance, and we found no trial of personal decision matrices.
| What it is | What the best evidence found | Evidence |
|---|---|---|
| Combining information by a fixed rule | Matched or beat human judges in most prediction studies | Meta-analysis, moderate6 |
| Combining applicant data by formula | Predicted job performance markedly better than experts’ holistic judgment | Meta-analysis, moderate1 |
| Rough or equal weights | Still beat clinical judges in the prediction studies reviewed | Expert review, moderate3 |
| Splitting a criterion into parts | The detailed parts drew more weight | Experiment, limited: abstract read4 |
| Scoring options as wholes | Overall liking colored ratings of separate features | Trial, limited: 118 students5 |
| Rating every attribute of every option | Weights flattened; fewer well-rated choices | Trial, limited: students, one follow-up7 |
| Swing weights and sensitivity checks | Recommended practice for public-sector appraisal | UK government guidance, expert2 |
| Decision matrices for personal choices | No trial found | Gap |
The practical reading: let the arithmetic do the combining, where the support is firmest, and use steps 5 and 6 to test your criteria, scores and weights, where it is thinnest.
The bottom line
A decision matrix earns its keep when a choice has several competing criteria and more than one opinion in the room. Choose a few criteria that don’t overlap, score one column at a time, weight each criterion by how much the difference between your options matters, and check whether the winner survives a change of weights. Treat the total as a strong argument rather than a verdict: when it disagrees with your gut, the gap usually points to a missing criterion or a wrong weight.
Frequently asked questions
Do the weights in a decision matrix have to add up to 100?
No. A total of 100 is a convenience, not a rule. The UK government's 2009 manual on multi-criteria analysis says any numbers can serve as weights as long as their ratios reflect how much you value each criterion's range, so a criterion weighted 40 should matter twice as much as one weighted 20. Totals of 100 simply make those ratios easy to read.
How many criteria should a decision matrix have?
As few as a sound decision allows. The UK government's 2009 manual on multi-criteria analysis sets no fixed rule; it notes that public-sector analyses typically use between six and twenty criteria and suggests grouping them under a few headings once there are about eight or more. It also warns that an excessive number of criteria adds analytical effort and makes the analysis harder to communicate.
Is the analytic hierarchy process the same as a decision matrix?
It is a close relative. The analytic hierarchy process, or AHP, also ends in a weighted sum, but it builds the weights and scores from pairwise comparisons, asking how much more important one criterion is than another. The UK government's 2009 manual notes that users find this convenient, and that specialists question its theory, partly because adding a new option can reverse the ranking of two others.
What should I do if two options end up with almost the same total?
Treat them as roughly equal. The UK government's 2009 manual on multi-criteria analysis notes that when the best options stay close under different weightings, accepting the second-best one costs little overall benefit. Rather than refining the arithmetic further, look for a criterion the matrix left out, or let a practical tiebreaker decide, such as which option is easier to change later.
Sources
- Mechanical versus clinical data combination in selection and admissions decisions: A meta-analysis. Kuncel, N. R., Klieger, D. M., Connelly, B. S. & Ones, D. S. (2013). Journal of Applied Psychology, 98(6)
- Multi-criteria analysis: a manual. Department for Communities and Local Government (2009). UK government, London
- The robust beauty of improper linear models in decision making. Dawes, R. M. (1979). American Psychologist, 34(7)
- The effects of splitting attributes on weights in multiattribute utility measurement. Weber, M., Eisenführ, F. & von Winterfeldt, D. (1988). Management Science, 34(4)
- The halo effect: Evidence for unconscious alteration of judgments. Nisbett, R. E. & Wilson, T. D. (1977). Journal of Personality and Social Psychology, 35(4)
- Clinical versus mechanical prediction: A meta-analysis. Grove, W. M., Zald, D. H., Lebow, B. S., Snitz, B. E. & Nelson, C. (2000). Psychological Assessment, 12(1)
- Thinking too much: Introspection can reduce the quality of preferences and decisions. Wilson, T. D. & Schooler, J. W. (1991). Journal of Personality and Social Psychology, 60(2)
- Thinking too much or too little? The effects of introspection on the decision-making process. Tordesillas, R. S. & Chaiken, S. (1999). Personality and Social Psychology Bulletin, 25(5)
How we researched this
Sources were found in September 2026 through Crossref, PubMed and web searches, starting from research comparing formulas with expert judgment and from UK government guidance on multi-criteria analysis, then looking for evidence on weighting errors and on when analysis harms a choice. Sources run from 1977 to 2013. Full texts were read except where noted: two papers were available only as abstracts. No trial we could find tests decision matrices for personal or small-team choices, which leaves the evidence indirect.
Keep reading
The Dunning–Kruger Effect: What It Really Says and What It Doesn't
The 1999 Dunning-Kruger paper never drew 'Mount Stupid'. Statistics explain part of its pattern, but two 2021 studies of about 4,000 people each found a gap.

Groupthink: What It Is, Famous Examples, and How to Prevent It
Groupthink is a group's wish to agree overriding its judgment. Janis's 8 warning signs, the Bay of Pigs and Challenger, and what research says prevents it.

Analysis Paralysis: Why You Can't Decide and How to Get Unstuck
Analysis paralysis ties to hard trade-offs and fear of regret. Why choices stall, how solid the research is, and 5 ways to get unstuck.

How We Make Decisions: The Psychology in Plain English
How we make decisions: fast impressions, slower checks and mental shortcuts, plus which classic findings held up across 36 samples and which did not.