The Dunning–Kruger Effect: What It Really Says and What It Doesn't
The 1999 Dunning-Kruger paper never drew 'Mount Stupid'. Statistics explain part of its pattern, but two 2021 studies of about 4,000 people each found a gap.

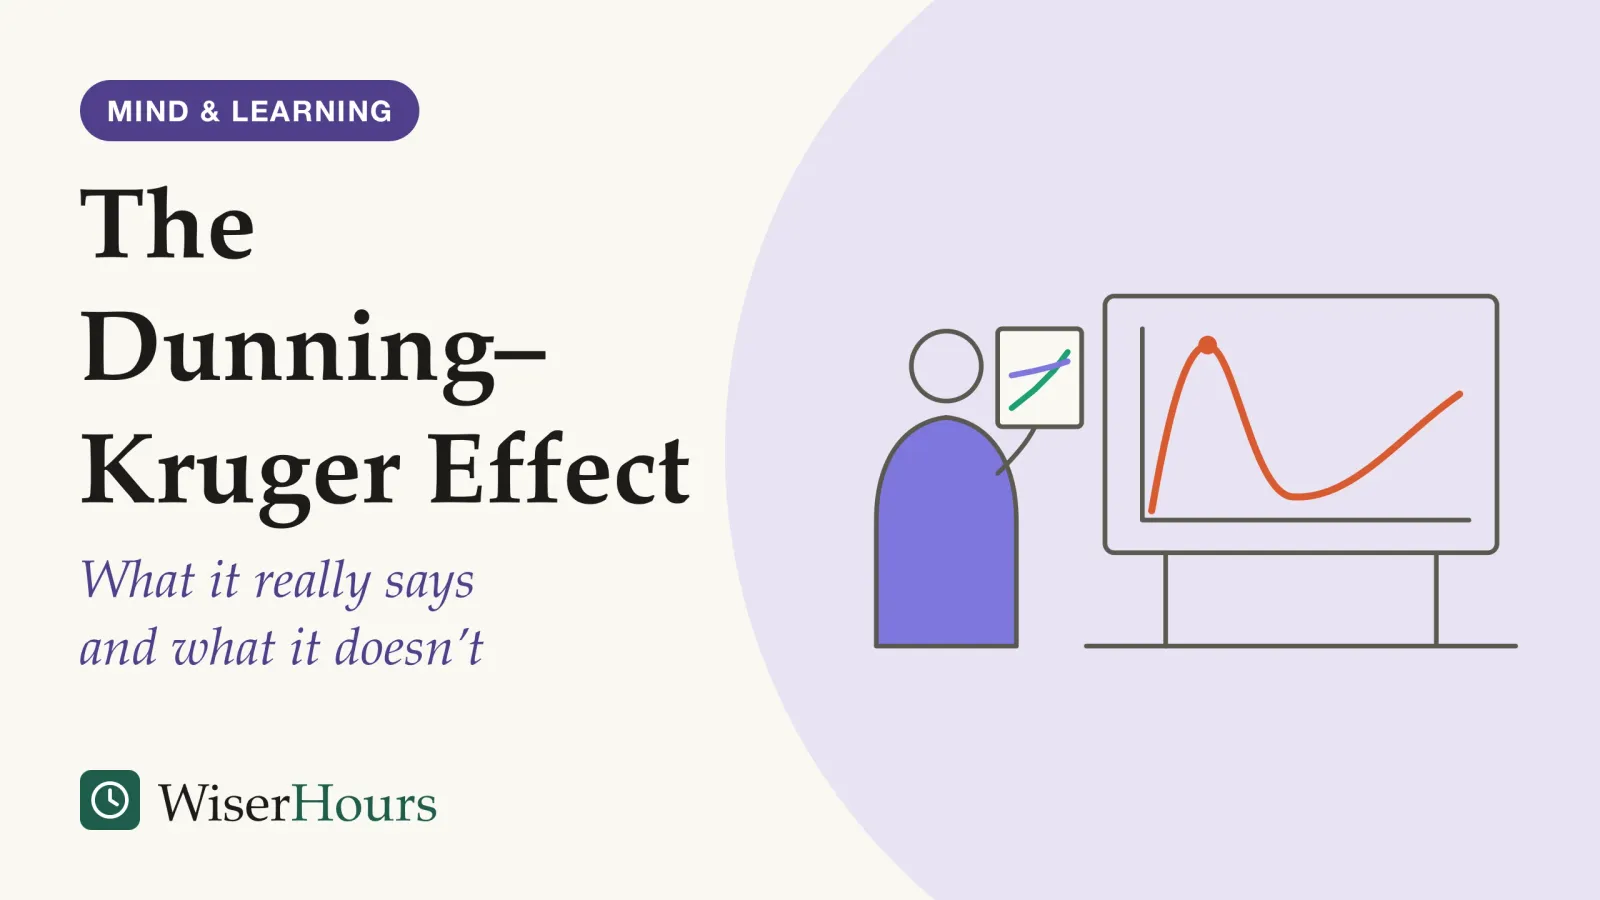
The chart most people share as the Dunning-Kruger effect, a beginner’s confidence shooting up a peak nicknamed “Mount Stupid” and then crashing, does not come from the research that named it. In 1999, Justin Kruger and David Dunning reported something plainer: on tests of logic, grammar and humor, the people who scored worst overestimated their performance by the widest margin. The authors argued that the skill needed to do well is the same skill needed to notice doing badly.1
Kruger and Dunning’s 1999 paper found that the weakest performers overrated themselves the most; it never showed that beginners feel more confident than experts.1 Since 2002, statistical critics have argued that much of even that narrow pattern comes from how the data were grouped and plotted, and the defenders have answered with bigger studies. Whichever side is right about the cause, the practical lesson is modest: on a skill you are still learning, treat your own sense of how it went as a rough guide, and look for feedback that checks specific answers. The effect belongs to the wider family of cognitive biases and the mental shortcuts behind them.
What the Dunning-Kruger effect actually claims
The Dunning-Kruger effect, as Kruger and Dunning stated it in 1999, is a claim about people who lack a particular skill: they make mistakes, and the same missing skill stops them from recognizing those mistakes, so they rate their own performance too highly. The authors called this a dual burden.1
The logic is easiest to see with grammar. To notice that a sentence in your report is broken, you need to know the rule it breaks. If you knew the rule, you would not have broken it. So the knowledge that produces a right answer is largely the knowledge that judges one, and a person without it gets no warning signal from inside.
Picture a new manager writing a first round of performance reviews. The reviews are vague in ways an experienced manager would spot at once, but the new manager reads them back and they look fine, because seeing what is missing takes the very experience they have not had yet.
The study
Moderate evidence
Where the name comes from: Kruger and Dunning's Cornell tests, 1999
Students took a short test, then estimated how their ability and their score compared with their classmates’. In the logic study, those in the bottom quarter of scores stood, on average, around the 12th percentile but placed their test score near the 62nd, while the top quarter placed themselves below where they actually stood. In the fourth study, a short logic-training packet given to a randomly chosen half of the participants made the weakest scorers much better at grading their own answers, and their inflated self-ratings came down.1
The caveats are the usual ones for a founding study: four small samples of students at one US university, on short tests, with most results coming from comparing groups rather than from experiments. The training study is the strongest part because it was randomized, and it points the way the theory predicts: build the skill and the self-assessment gets better too.
The lesson is narrow on purpose. On one specific skill, the people with the least of it are the least able to check their own work in it, so their confidence says little about their accuracy. If you are new to a task such as a sales forecast or a first contract draft, have someone who already has the skill check one sample of your work before you trust your own sign-off.
The “Mount Stupid” curve is not in the original paper
The popular Dunning-Kruger chart, a curve of confidence that shoots up for beginners, crashes and then climbs slowly with experience, does not appear in Kruger and Dunning’s 1999 paper. Its figures plot something plainer: estimated and actual test standing for four groups of students, sorted by their score.1
Three differences matter. First, the paper compared different people within single sessions; it did not follow anyone over months of learning, so it says nothing about how one person’s confidence rises or falls with experience. Second, self-estimates rose with real skill: the authors found perceived and actual ability modestly correlatedcorrelation: A measure of how closely two things move together, running from minus one, where one rises as the other falls, through zero, meaning no link, to plus one. It says how strong the relationship is, not what causes it, and it is not a percentage.Full entry in the glossary, so the weakest groups rated themselves lower than the strongest ones, just not low enough. Third, the weakest groups, on average, put themselves somewhat above the middle of the class, not near the top.1
- The popular curve: one person over time, with confidence peaking early; the 1999 paper never measured this
- What the paper measured: four groups of different people, sorted by one test score and asked in a single session how they did
- Self-estimates rise gently: weaker scorers rated themselves lower than stronger ones, but on average every group placed itself above the middle
- The top group: the best scorers placed themselves somewhat below where they actually stood
The tests were also about specific skills, such as spotting grammar errors, not general intelligence. That matters when the effect is used as an insult. Everyone is in the bottom quarter of some skill, and the claim is about how poorly people judge their own work in that skill.
- Myth
- Beginners feel more confident than experts, so confidence peaks at Mount Stupid.
- Fact
- In the 1999 studies, low scorers rated themselves lower than high scorers did, just not low enough. The paper compared groups in single sessions; it did not track anyone's confidence over months of learning.
So when someone shows you the curve, ask two questions: who was measured, and was it the same person at different times? A chart of different people at one moment cannot tell you how confidence changes while one person learns.
Why regression to the mean can draw the same pattern
Two ordinary statistical facts can produce the Dunning-Kruger pattern on their own, Joachim Krueger and Ross Mueller argued in 2002: most people rate themselves above average, and self-ratings track real scores imperfectly. Their model accounts for the lopsided errors without assuming that low scorers have less insight.2
The mechanism is regression to the mean. A test score is partly skill and partly luck on the day: a misread question, a lucky guess. Sort people by score and the bottom group collects everyone who had a bad day, while their own estimates, which never shared that bad luck, sit nearer the middle. The top group gets the mirror image. Add a general lean toward rating yourself above average, the cognitive biascognitive bias: A predictable way in which judgments depart from a standard such as logic or probability. Most are ordinary mental shortcuts applied in the wrong setting rather than defects, and some well-known ones have not held up when tested again.Full entry in the glossary psychologists call the better-than-average effect, and the bottom group’s gap grows large while the top group’s shrinks.
Kruger and Dunning saw part of this coming. In 1999 they wrote that regression makes some of their result nearly inevitable, but argued that the errors were too lopsided for regression to be the whole story.1 In Krueger and Mueller’s replication study, the lopsidedness vanished once either regression or the better-than-average effect was removed statistically.2
Two later papers widened the doubt. Edward Nuhfer and colleagues used random-number simulations in 2016 to show that the quartile line charts common in this research create artifacts that invite misreading.3 And across 12 tasks in 2006, Katherine Burson, Richard Larrick and Joshua Klayman found that on harder tasks the best performers judged their standing less accurately than the worst.4
You can see the trap in a sales team. Rank the reps after a slow quarter and ask each how they did: the bottom of the list looks deluded, but part of their low rank was a quarter nobody could have predicted. Before concluding that the weakest people are the most deluded, check whether a bad day and a general optimism could explain the gap.
With sharper tests, the extra blind spot mostly fades
When Gilles Gignac and Marcin Zajenkowski used statistical tests that, they argue, the two artifacts cannot fake, the effect largely disappeared for intelligence. In their 2020 study of 929 people tested in a Warsaw laboratory, people misjudged their own intelligence by roughly the same amount at every level of ability.5
They first showed the problem with made-up data. Simulated scores containing only a better-than-average lean and a modest link between self-ratings and real scores, grouped into quarters, produced the classic chart with no deficit built in. Their real data produced it too. But two sharper tests found nothing extra at the bottom: errors did not spread wider at low ability, and self-ratings rose with real intelligence in a straight line rather than bending at the low end.5
The title says “mostly”, and the authors mean it. They note that some published effects, such as the first 1999 study, look too large to be artifacts entirely, and they tested one ability with one reasoning test.5 A 2017 follow-up by Nuhfer’s group, on science-literacy self-assessments, concluded that people’s self-assessments generally reflect real competence, while still finding experts better at self-assessment than novices.6
Think of a team rating its own presentation skills before a training course. On this reading, the seasoned presenter and the nervous newcomer may misjudge themselves by a similar margin; the quartile chart simply makes the newcomer’s error look like the only one. So check everyone’s self-rating against something outside their head, your own included, rather than assuming the least skilled person is the only one misreading.
The defense: weaker performers are worse at spotting their own errors
Dunning and his colleagues answered the statistical critique with studies designed to rule it out, and a large 2021 replicationreplication: Running a study again with fresh data and the same method, to see whether the original result comes back. A finding that fails to replicate is not automatically wrong, but it stops being something you can lean on.Full entry in the glossary supports the core of their claim: on grammar and logic tests, people who perform poorly are less able to tell which of their own answers are right.
In 2008, Joyce Ehrlinger and colleagues, including Dunning and Kruger, corrected for how unreliable their tests were, and the bottom group’s overestimation shrank only slightly. Offering up to $100 for accurate self-estimates did not fix it either, and the pattern showed up in class exams and a college debate tournament.7 This is the theory’s authors testing their own idea, funded by a US mental-health research grant to Dunning.
The 2021 study, by Rachel Jansen, Anna Rafferty and Thomas Griffiths, started from a model in which everyone reasons sensibly: a person who expects to do well and has only a hazy sense of which answers were right will lean toward that expectation, which alone can produce the pattern. They compared it with a version in which low performers also have a hazier sense of their own accuracy. Run as two studies of about 4,000 participants each on grammar and logic, the replication favored the second version.8
Matan Mazor and Stephen Fleming, writing alongside that study, add a caution: the effect is not merely a statistical artifact, but it may be a single burden rather than a double one, with the same weakness showing up twice, once in answering and once in judging the answers.9
Dunning’s own 2022 reply, an opinion essay in the British Psychological Society’s publication The Psychologist rather than a new study, makes a point both sides can use: the pattern of misjudgment is there whatever produces it, so the real quarrel is about the cause. He adds that the effect is strongest where people apply a confident but mistaken rule, such as assuming money grows in a straight line rather than compounding.10
Picture someone who holds that straight-line rule. Every savings question they answer goes wrong in the same direction, and the rule gives a clean answer each time, so nothing feels off. When a result surprises you on something you felt sure of, look for the rule you applied before blaming bad luck.
How to use the finding without misusing it
The Dunning-Kruger effect is most useful as a warning about feedback, not as a label for other people. On skills where you get no clear signal of error, your confidence is weak evidence, and a 2017 analysis of science-literacy self-assessments found novices judge themselves less accurately than experts do.6
The one fix tested directly in the original paper is to build the skill that lets you grade your own answers. In the 1999 training study, a short lesson on logic helped the weakest scorers grade their own answers, because it gave them the rule to check those answers against.1
In practice that means looking for checkable feedback on specific answers: a colleague who reviews your analysis line by line, a record of which forecasts came true, a test with an answer key. A general sense of “that went well” is exactly the signal the research says is unreliable.
Watch for confident errors, which Dunning ties to mistaken rules applied consistently.10 If a rule feels obvious but you cannot say where you learned it, test it on one case where you know the answer before relying on it. And apply the finding to experts too: top performers misjudged their standing in the original studies, just in the other direction.
| What it is | What the best evidence found | Evidence |
|---|---|---|
| Low scorers overestimate their standing most | Seen in four small studies of US students on humor, grammar and logic | Lab studies, moderate1 |
| Statistics alone can draw the chart | Simulated data with no deficit reproduced the classic quartile chart | Simulation, moderate5 |
| Equal misjudgment at every ability level | Found for self-rated intelligence in 929 people in Poland | Observational, limited5 |
| Low scorers are worse at spotting their own errors | Favored in a 2021 replication run as two studies of about 4,000 people each | Replication with modeling, moderate8 |
| Training the skill improves self-assessment | A logic lesson helped the weakest scorers grade their own answers | Small randomized study, limited1 |
The bottom line
Without the meme, the Dunning-Kruger effect is a modest claim: on a specific skill, people with less of it are somewhat worse at judging their own work, and part of the famous gap is statistics. It does not say beginners are more confident than experts. Treat your own confidence on a new skill as a weak signal, and go looking for feedback that can prove you wrong.
Frequently asked questions
Does the Dunning-Kruger effect mean unintelligent people think they are smart?
No. Kruger and Dunning's 1999 studies tested specific skills, such as spotting grammar errors or solving logic problems, not general intelligence. The weakest scorers placed themselves somewhat above average, not at the top, and rated themselves lower than the strongest scorers did. The claim is about judging your own work in a particular skill, which everyone lacks somewhere.
Do experts underestimate themselves?
Somewhat, in relative terms. In Kruger and Dunning's 1999 studies the top scorers placed themselves below their actual standing, and after grading other students' tests they raised their estimates, which the authors read as top performers overestimating their peers. A 2006 set of 12 tasks by Burson and colleagues found that on hard tasks the best performers judged their standing less accurately than the worst.
Is the Dunning-Kruger effect the same as overconfidence?
No. General overconfidence, and the better-than-average effect in particular, means most people rate themselves too highly. The Dunning-Kruger effect is a narrower claim about how that error varies with skill: Gilles Gignac and Marcin Zajenkowski describe it as misjudgment that is larger at the low end of ability than at the high end.
Sources
- Unskilled and unaware of it: How difficulties in recognizing one's own incompetence lead to inflated self-assessments. Kruger, J. & Dunning, D. (1999). Journal of Personality and Social Psychology, 77(6)
- Unskilled, unaware, or both? The better-than-average heuristic and statistical regression predict errors in estimates of own performance. Krueger, J. & Mueller, R. A. (2002). Journal of Personality and Social Psychology, 82(2)
- Random Number Simulations Reveal How Random Noise Affects the Measurements and Graphical Portrayals of Self-Assessed Competency. Nuhfer, E., Cogan, C., Fleisher, S., Gaze, E. & Wirth, K. (2016). Numeracy, 9(1), Article 4
- Skilled or unskilled, but still unaware of it: How perceptions of difficulty drive miscalibration in relative comparisons. Burson, K. A., Larrick, R. P. & Klayman, J. (2006). Journal of Personality and Social Psychology, 90(1)
- The Dunning-Kruger effect is (mostly) a statistical artefact: Valid approaches to testing the hypothesis with individual differences data. Gignac, G. E. & Zajenkowski, M. (2020). Intelligence, 80, 101449
- How Random Noise and a Graphical Convention Subverted Behavioral Scientists' Explanations of Self-Assessment Data: Numeracy Underlies Better Alternatives. Nuhfer, E., Fleisher, S., Cogan, C., Wirth, K. & Gaze, E. (2017). Numeracy, 10(1), Article 4
- Why the unskilled are unaware: Further explorations of (absent) self-insight among the incompetent. Ehrlinger, J., Johnson, K., Banner, M., Dunning, D. & Kruger, J. (2008). Organizational Behavior and Human Decision Processes, 105(1)
- A rational model of the Dunning–Kruger effect supports insensitivity to evidence in low performers. Jansen, R. A., Rafferty, A. N. & Griffiths, T. L. (2021). Nature Human Behaviour, 5(6)
- The Dunning-Kruger effect revisited. Mazor, M. & Fleming, S. M. (2021). Nature Human Behaviour, 5(6)
- The Dunning-Kruger effect and its discontents. Dunning, D. (2022). The Psychologist, British Psychological Society
How we researched this
The search, done in September 2026, used Crossref, PubMed, Europe PMC and the open web, beginning with Kruger and Dunning's 1999 paper and tracing its statistical critics and its defenders up to 2022. The 1999 paper and the main critique and defense papers were read as full texts; for five sources only the abstract could be opened, and nothing here goes beyond what those abstracts state. Main limitation: most studies use short tests with students or online volunteers.
Keep reading
Cognitive Biases Explained: Why Your Brain Takes Shortcuts
Cognitive biases are shortcuts misfiring, not brain defects. Anchoring and framing survived a retest in 36 samples; bias scores barely correlate.

Groupthink: What It Is, Famous Examples, and How to Prevent It
Groupthink is a group's wish to agree overriding its judgment. Janis's 8 warning signs, the Bay of Pigs and Challenger, and what research says prevents it.
Analysis Paralysis: Why You Can't Decide and How to Get Unstuck
Analysis paralysis ties to hard trade-offs and fear of regret. Why choices stall, how solid the research is, and 5 ways to get unstuck.
How to Use a Decision Matrix: Comparing Options With Weighted Criteria
How to build a decision matrix in 6 steps: pick criteria that don't overlap, score one column at a time, weight the gaps, then test the winner.