Little's Law Explained: The Simple Formula Behind Lead Time
Little's law links three averages: work in progress = throughput x lead time. How to use it, the 5 conditions it needs, and the mistake to avoid.

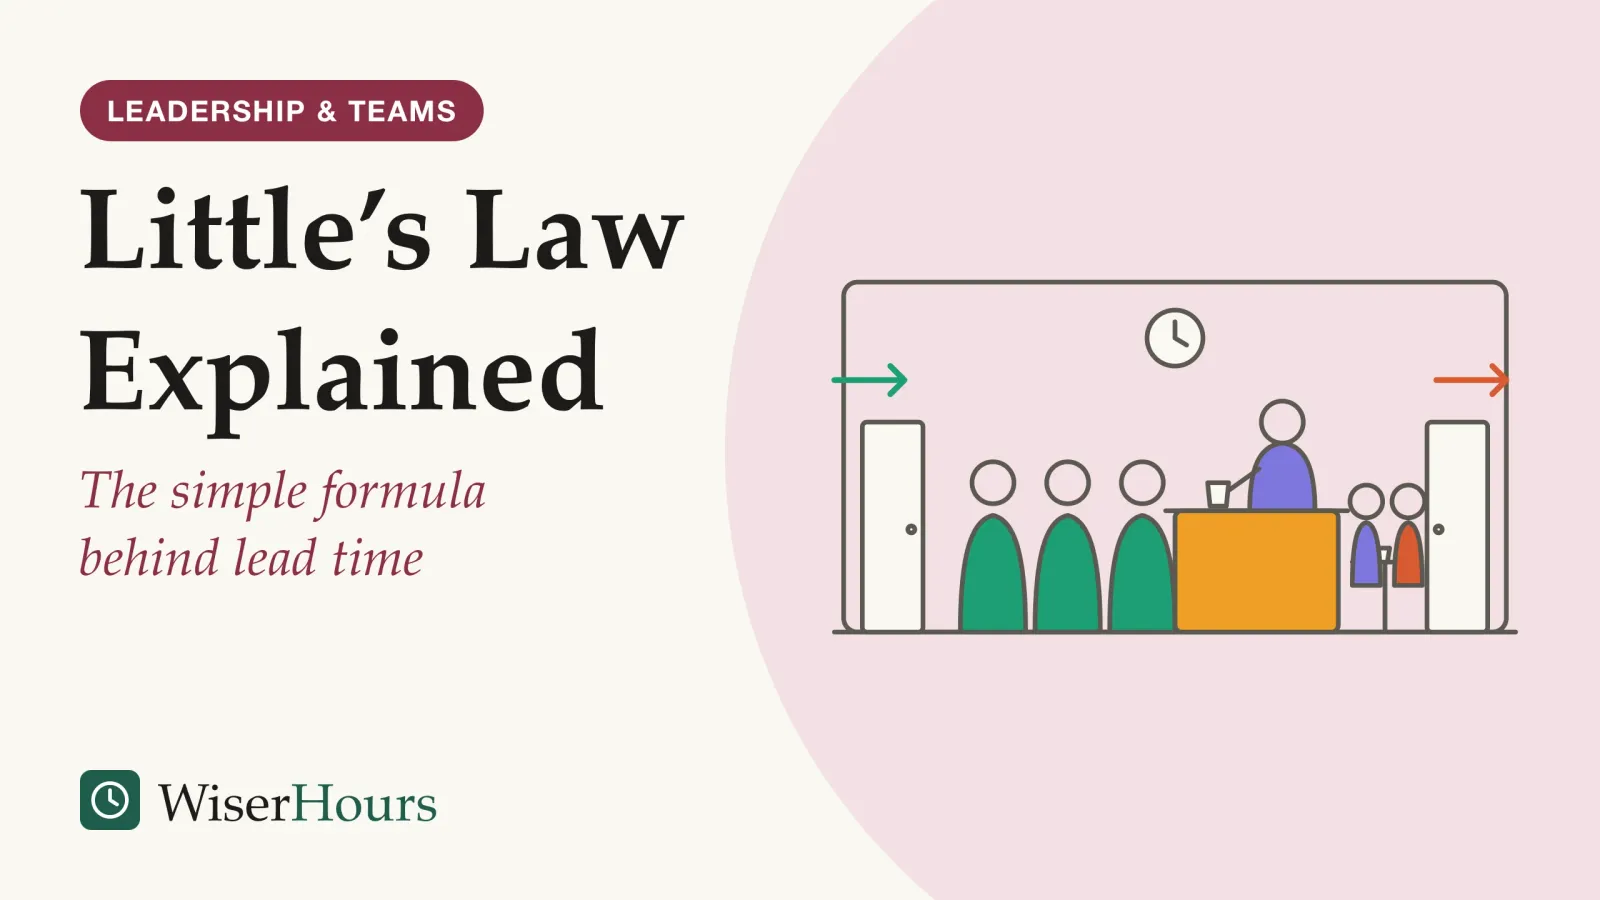
Little’s law says that, over a stable stretch of time, the average number of items inside a system equals the average rate at which they pass through multiplied by the average time each one spends inside. John Little published a general proof in 1961,1 and the formula needs almost no assumptions about how the work is done.2 For a team, it reads: average work in progress = throughput × average lead time. Turn it around and you get the version managers use most: lead time = work in progress ÷ throughput. A team with about 30 tickets open that finishes about 10 a week has an average lead time of about 3 weeks.
Few tools in process improvement, the deliberate work of making recurring work faster and more reliable, are this exact. The law also comes with conditions that most quick explanations leave out, and one tempting misuse.
What is Little’s law in simple terms?
Little’s law is a rule about averages in any system where things arrive, wait or get worked on, and leave. In John Little’s 2011 review of the law’s first 50 years in Operations Research, the items could be cars at a toll booth, people in a cafeteria line or instructions waiting inside a computer.3
Definition
Little’s law states that the long-run average number of items in a system equals their average arrival rate multiplied by the average time each spends in the system, written L = λW.
The textbook letters are L for the average number inside, λ (lambda) for the arrival rate and W for the average time inside.2 The surprise is what the law leaves out: the number of servers, the order of service, and how bunched or random the arrivals are. None of them change the relationship.4
A café makes it concrete. Suppose that, on a weekday morning, about 60 customers come through the door each hour and the average customer stays half an hour, queueing, ordering and drinking. Little’s law says that on average about 30 customers are inside at any moment. If you could count only the people inside and the people leaving each hour, you could work out the average stay without timing a single customer.
- 1Arrivethe arrival rate, or throughput when counted on the way out
- 2Wait and get worked onthe time inside, or lead time
- 3Leave
Little gave a plain reason why the law holds. A customer standing in line can be counted, and at the same moment that customer is adding minutes of waiting. The same stretch of time therefore shows up twice, once as “number of people present” and once as “minutes waited”, so the two averages cannot drift apart.3
Pick any two of the three numbers you can measure cheaply and let the law hand you the third.
How to calculate lead time with Little’s law
To calculate average lead time, divide the average number of items in progress by the average number finished per unit of time. Operations managers write the law as throughput = work in process ÷ cycle time, the form in Wallace Hopp and Mark Spearman’s textbook Factory Physics, John Little and Stephen Graves explain, so cycle time = work in process ÷ throughput.4
A team’s ticket board shows the arithmetic. Over the last quarter the team has had about 30 tickets started and not yet finished at any one time, and it finishes about 10 tickets a week. Average lead time is 30 ÷ 10, or about 3 weeks from start to finish. Nobody had to look up a single ticket’s start date.
Little and Graves give a personal version. A student who receives about 50 emails a day needing a reply, and whose inbox of unanswered messages averages 150, takes about 3 days on average to answer a message.4
The second and third forms matter as much as the first. If you know how long jobs usually take and how many are open, you can estimate how many your team finishes. That number is useful when someone asks for a delivery date and nobody has counted completions.
Before you divide, write down where “started” and “finished” sit on your board, and measure all three numbers over the same period.
What are the assumptions of Little’s law?
Little’s law holds exactly over a period that starts and ends with the system empty, and approximately over a long period in which the system is stable. John Little and Stephen Graves list the conditions for a system that never empties: work in equals work out on average, everything started gets finished, and the amount in progress is roughly the same at the start and end of the period.4
They add one more: the average age of the work in progress should be neither growing nor shrinking. If old items pile up untouched while new ones flow past them, the averages stop fitting together.4 A product vendor, Planview, lists the same conditions in a help page for its software delivery tool, credits them to the kanban author Daniel Vacanti, and adds a fifth: all three numbers must use consistent units.5
The study
Strong evidence
Little's Law as Viewed on Its 50th Anniversary (John Little, 2011)
Writing 50 years after his proof, John Little showed that over a finite period that starts and ends empty, the law is exact for the data actually observed, whatever the order of service and even when arrivals rise and fall through the day, as they do in a supermarket. That exactness holds only after the fact, once the period is over.3
The weak point is usually the team’s data, so turn each condition into a test of your board:
- Keep the flow stable. If the team starts 15 tickets a week and finishes 10, work in progress grows every week and last month’s average lead time is already out of date.
- Make finished mean finished. Tickets quietly abandoned in a column count as work in progress forever. Close or remove them.
- Use the same window and the same units. Mixing tickets finished per week with a count of tasks or story points, or with days, produces a number that looks precise and means nothing.
- Average over long enough. A single week can start with a backlog and end with a clear board; averages over several weeks wash those edges out.4
When a condition fails, the formula still produces a number, so check the four points above before quoting any result to a manager or customer.
Why Little’s law can’t predict when one item will finish
Little’s law relates averages over a past period, so it cannot say when one particular item will finish. John Little and Stephen Graves stress that even the exact form of the law is exact only after the fact, once the period has ended and every arrival and departure is known.4
It merely says that we are observing and measuring not forecasting.
The common misuse looks innocent. A manager adds a request to a board with 30 open tickets and a throughput of 10 a week, then promises the customer delivery “in 3 weeks”. The 3 weeks is an average across many tickets. Some small fixes leave in a day; a few large ones sit for months. The customer’s item could be either.
- Myth
- With 30 tickets open and 10 finished a week, a new ticket will be done in 3 weeks.
- Fact
- Three weeks is the average across many tickets. A single ticket can finish in days or wait for months.
Planview’s help page calls a quantitative forecast from the law an incorrect application, because the law examines what happened in the past.5 The Kanban Guide, written by John Coleman and Daniel Vacanti, offers a different tool for single items: a service level expectation, built from the team’s own history of how long items took, with a probability attached (“most items finish within so many days”).6
Use the law to understand the system, and use the spread of past finish times to answer “when will mine be done?”.
Why starting less work shortens lead time
At a steady finishing rate, cutting the average amount of work in progress cuts average lead time in the same proportion. Little and Graves note that, by the law, any increase in output needs more work in progress, a shorter cycle time, or both.4 Read the other way, shorter lead time needs either faster finishing or less work open at once.
- Same finishing rate: both teams finish the same number of items each week
- Different amounts started: the left board has twice as many items in progress as the right
- Different average wait: so each item on the left spends about twice as long in progress, on average
Faster finishing usually costs something: more people, better tools, fewer defects, removed handoffs. Less work in progress costs only a decision to stop starting new items until others finish. Back on the ticket board, if the team holds open tickets at about 15 instead of 30 and still finishes about 10 a week, average lead time falls from about 3 weeks to about one and a half weeks. The extra requests wait in a queue that has not started, where they cost nothing but patience.
Factories use the same idea. Little and Graves describe CONWIP, a rule that releases one new job only when one finishes so the amount in progress stays constant, as a very effective control policy.4 In kanban the cap is called a WIP limitWIP limit: A cap on how many work items can be in progress at once, used in kanban so that new work starts only when something is finished. The aim is to finish work sooner and see where it gets stuck, not to keep everyone busy.Full entry in the glossary, and personal kanban applies the law to one person’s task list.
All of this assumes throughput holds steady. If work in progress falls so low that people sit idle waiting for reviews or approvals, throughput drops too and the arithmetic no longer favors cutting further. To see where work waits and why before setting any limit, trace the flow on a value stream map.
How Little’s law is used in kanban and agile
Kanban and agile teams use Little’s law to connect the flow metrics they already track. The 2025 Kanban Guide by John Coleman and Daniel Vacanti asks every kanban team to measure four: work in progress, throughput, work item age and cycle time, where cycle time is the time from when an item started to when it finished.6
Three of those four are the terms of Little’s law, so a team can check its own data. If the board’s average work in progress divided by weekly throughput is far from the measured average cycle time, something is off: items not closed, inconsistent start points, or a period in which work piled up. Little reports the same use in US hospitals, where Bill Lovejoy of the University of Michigan called the law a reality check on spreadsheets that did not add up.3
The fourth metric, work item age, catches what the averages miss. The guide asks teams to make sure items do not age unnecessarily, using their service level expectation as the reference, so an item far older than that is flagged as stuck before it drags next month’s average up.6
The software evidence is thin but consistent with the law. A 2018 case study by Dag Sjøberg, covering five kanban teams at a single company and more than 8,000 tracked items over four years, reported shorter lead times where work in progress was lower; its productivity results ran against the kanban literature’s claim that a low limit improves productivity. Only the study’s abstract was available to us.7
Each week, divide average work in progress by throughput and compare the result with your measured cycle time; a large gap is a data problem to fix first.
What Little’s law cannot tell you
Little’s law tells you nothing about variability, peaks or worst cases, and nothing about why the numbers are what they are. In their example of a maternity ward averaging 12.5 mothers, Little and Graves note that the ward needs more beds than that average to cope with busy days, and that sizing it needs queueing models or simulation.4
The same gap shows up in office work. A team with an average lead time of 3 weeks may deliver most items in a week and a handful in three months. When a customer or manager asks about the slow cases, answer with the spread of past finish times, such as how long the slowest tenth of items took.
The law also does not tell managers how to make trade-offs or what to change. Little writes that it locks the three measures together but leaves the improving to other methods, such as Lean and Six Sigma work on delays at each step.3 Long queues also tend to create inefficiencies of their own, which Little calls queue-related overhead; the law can help measure them but does not predict them.3
Before you use Little's law on your team
The bottom line
Little’s law is exact arithmetic about the past: average work in progress equals throughput times average lead time, as long as the period is stable and the units match. Its most useful lesson is that, at the same finishing rate, less work started means shorter lead time. This week, count your team’s open items and weekly completions, divide the first by the second, and compare the result with the lead time you think you have.
Frequently asked questions
Does Little's law apply to software development?
Yes, when the team's process meets its conditions. A software team's board is a queueing system: tickets arrive, wait, get worked on and leave. Dag Sjøberg's 2018 case study of five kanban teams at one software company, covering more than 8,000 work items, linked lower work in progress with shorter lead times.
Who discovered Little's law?
The relationship was used before anyone proved it. Philip Morse stated it in his 1958 book Queues, Inventories and Maintenance and challenged readers to find a case where it failed. John Little, then at the Case Institute of Technology in Cleveland, published the first general proof in Operations Research in 1961.
What is the difference between Little's law and the kanban WIP limit?
Little's law is a mathematical relationship between three averages; a WIP limit is a management rule that caps how many items may be in progress at once. The Kanban Guide asks teams to control work in progress explicitly. Little's law explains why holding that number down shortens average lead time when the finishing rate stays steady.
Sources
- A Proof for the Queuing Formula: L = λW. Little, J. D. C. (1961). Operations Research, 9(3), 383-387
- Little's law. Wikipedia, accessed 2026-10-17
- Little's Law as Viewed on Its 50th Anniversary. Little, J. D. C. (2011). Operations Research, 59(3), 536-549
- Little's Law. Little, J. D. C. & Graves, S. C. (2008). In Building Intuition: Insights From Basic Operations Management Models and Principles, Springer, 81-100
- How does Viz use Little's Law? Planview Customer Success Center (2021), product FAQ, accessed 2026-10-17
- The Kanban Guide. Coleman, J. & Vacanti, D. (2025). Kanban Guides, version 2025.5
- An empirical study of WIP in kanban teams. Sjøberg, D. I. K. (2018). Proceedings of the 12th ACM/IEEE International Symposium on Empirical Software Engineering and Measurement (ESEM 2018)
How we researched this
We read John Little's 2011 anniversary paper and the 2008 chapter he wrote with Stephen Graves in full, plus the Wikipedia entry and Crossref record for the 1961 proof. For practice we used the 2025 Kanban Guide, a vendor's explanation of the law's assumptions, and one software case study read only as an abstract. Searches ran in October 2026. Main limitation: little research tests the law's practical use in office teams.
Keep reading
Systems Integration: When Your Tools Don't Talk to Each Other
Systems integration in plain words: 4 ways to connect a CRM, invoicing tool and spreadsheet, their hidden costs, and when a manual step is fine.
Business Process Reengineering: What It Is and Why It Got a Bad Name
Business process reengineering redesigns work from a blank sheet. Where the 70 percent failure claim came from, why BPR meant layoffs, and when it fits.
Efficiency vs. Effectiveness: Why the Difference Matters
Efficiency vs effectiveness: one asks what work costs, the other whether it hits the goal. Drucker's line, 4 combinations and how to measure each.

How to Write a Standard Operating Procedure: A Step-by-Step Guide
How to write a standard operating procedure in 7 steps, from deciding whether a task needs one to testing the draft on someone new. What the guidance says.