Loss Aversion: Do Losses Really Loom Larger Than Gains?
Loss aversion makes a loss sting more than an equal gain pleases. Evidence since 1979 says it is real on average, but weak or absent when stakes are small.

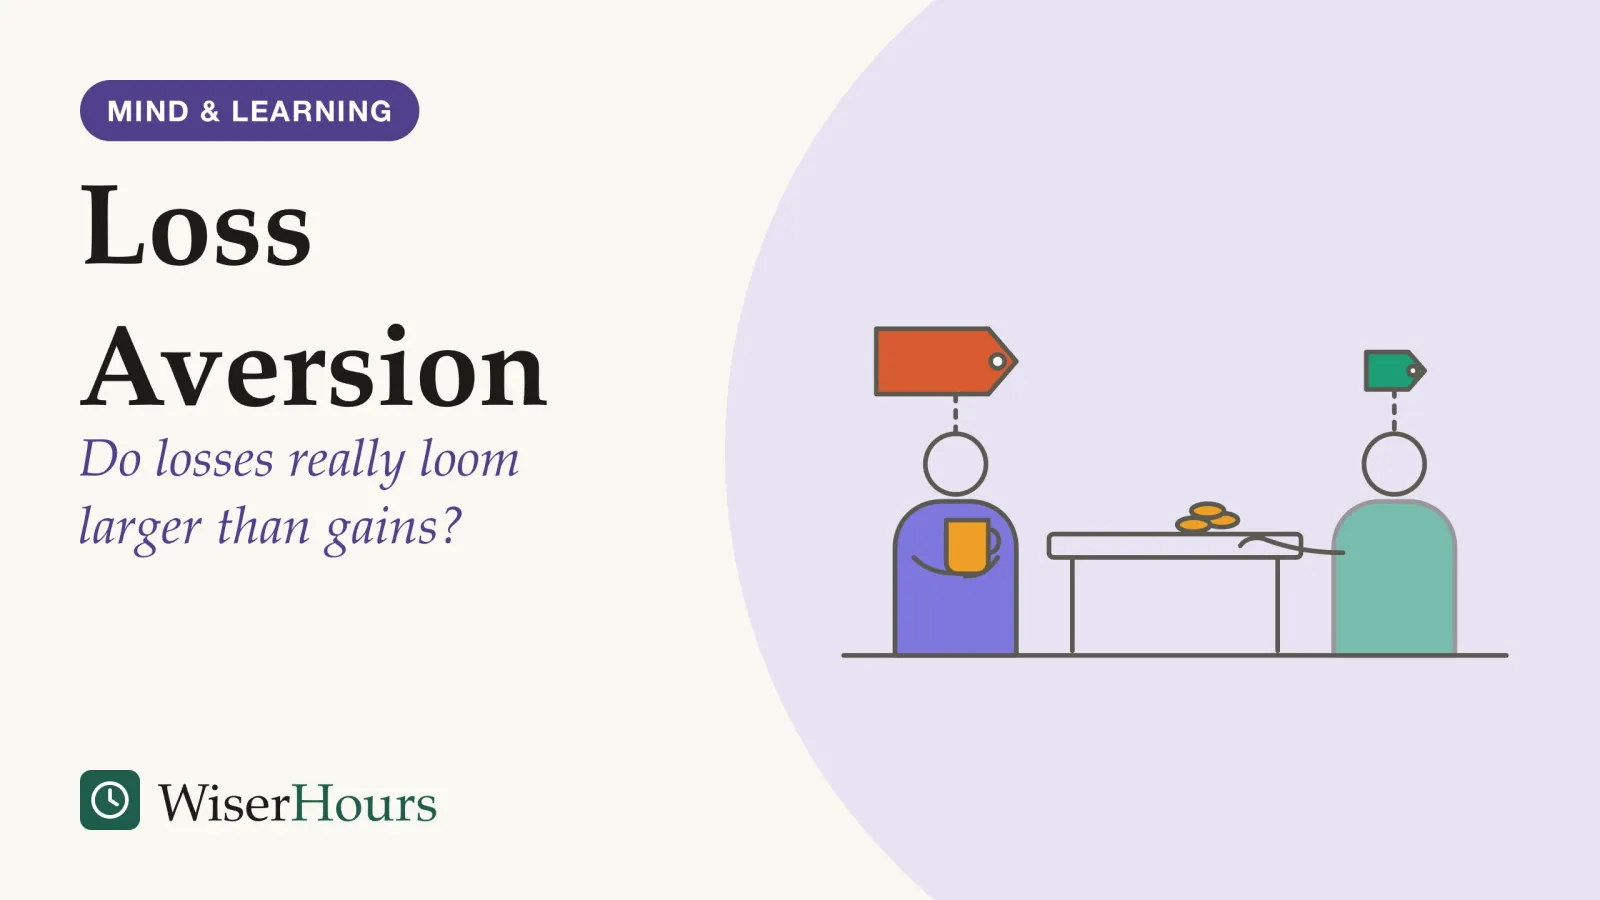
Loss aversion is the tendency to feel a loss more sharply than a gain of the same size. Losing a sum of money tends to annoy people more than gaining the same sum pleases them, which is why so many turn down a fair coin-toss bet. Daniel Kahneman and Amos Tversky put the idea at the center of prospect theory in 1979, in a phrase that stuck: losses loom larger than gains.1
Do they, though? On average, yes, but by less than the famous figure and not in every setting. Pooling estimates from economics, psychology and neuroscience, Alexander Brown, Colin Camerer and two colleagues concluded in a 2024 meta-analysis that a typical loss weighs just under twice an equal gain.2 With small sums of money, several experiments find little or none of it. Loss aversion is one of the cognitive biases that shape everyday judgment, and one quick check against it is to restate a choice as if you were starting fresh today and see whether the loss is still there.
What is loss aversion in simple terms?
Loss aversion, in simple terms, means a loss feels bigger than a gain of the same amount. In Kahneman and Tversky’s 1979 prospect theory, people judge an outcome as a gain or a loss from a reference point, usually where they stand now, and the value curve drops more steeply for losses than it rises for gains.1
The reference point does most of the work. Classical economics judged choices by final wealth, so 100 lost and 100 won should cancel out. Kahneman and Tversky argued that people react to changes, and that a change downward carries more weight. Their evidence was simple: most people find an even-odds bet to win or lose the same amount distinctly unattractive, and they dislike it more as the stake grows.1
The reference point is not always what you own. Later work by the economists Botond Kőszegi and Matthew Rabin treated expectations as a reference point too, so a result that falls short of what you expected can register as a loss even when nothing has been taken away.3 A pay rise smaller than the one you were counting on can sting like a cut.
- Reference point: where you start, often what you have now or what you expected
- Gains: the curve rises, then flattens: each extra unit adds less
- Losses: the curve falls more steeply than it rises on the gain side
- Equal change, unequal feeling: a loss and a gain of the same size, and the loss moves you further
When a choice feels oddly painful, name the point you are measuring it from. Moving that point, by comparing both options with where you expect to be in a year rather than where you are today, often changes which one looks like the loss.
Everyday examples of loss aversion, from card surcharges to falling shares
Common examples of loss aversion include reacting more to a surcharge than to an equal discount, asking far more to sell something you own than you would pay to buy it, and holding on to shares that have fallen in price. Each one sets the same outcome against a reference point and treats the downward side as heavier.
Prices show it most plainly. The same price gap presented as a discount, or as a surcharge you avoid, changes how shoppers respond, according to Wikipedia’s overview of the research.3 The money involved is identical; only the direction from the reference point changes. The same mechanism drives the wider framing effect in how proposals are worded.
Ownership shows it too. In Kahneman, Knetsch and Thaler’s 1990 experiments with university students in the US and Canada, people given a coffee mug at random asked much more to part with it than others were willing to pay, and fewer mugs changed hands than economic theory predicted.4 The same pull keeps unused things in cupboards, as our guide to why owned things are hard to let go describes.
For investors, economists have used loss aversion to explain the disposition effect, the habit of selling winning investments sooner than losing ones, Gal notes in reviewing where the idea has been applied.5 The disposition effect and why people hold on to losers has its own guide, and a related pull, refusing to write off money already spent, is covered in the piece on the sunk cost fallacy.
Before reacting to a price or a sale, restate it the other way round. If a surcharge would make you change course but the same amount offered as a discount would not, the wording is deciding for you.
Losses weigh 1.3 to 2 times as much as gains in pooled studies
Pooled estimates put losses at between about 1.3 and 2 times the weight of equal gains, below the 2.25 figure many analyses and models still use. That famous number came from a small, unpaid exercise, and later pooled analyses with far more data have pulled it down.
The 2.25 traces back to Tversky and Kahneman’s 1992 update of prospect theory. As Brown and colleagues explain, it was the median from 25 graduate students at elite universities on the US west coast, who made choices between lotteries without real money at stake, and no average or spread was reported.2 It became the default anyway.
The study
Moderate evidence
What 607 estimates of loss aversion add up to
The team gathered 607 published and unpublished estimates of loss aversion from 150 articles in economics, psychology, neuroscience and other fields, reported between 1992 and 2017. Their model put the average loss aversion coefficient at 1.955, with a 95 percent probability that the true value lies between about 1.82 and 2.10. Few study characteristics were strongly linked to differences in the estimates.2
A coefficient of about 2 means that, on average, a fifty-fifty bet that could lose 10 would need a possible win of around 20 before it felt even. The authors also checked for publication bias: low estimates seemed to go missing from the literature, and correcting for it brought the average down to about 1.7 in their 2022 working version. Even so, more than nine in ten of the estimates in that version sat above 1, the point where losses and gains would count the same.2
A narrower test gives a smaller number. Lukasz Walasek, Timothy Mullett and Neil Stewart pooled only studies that estimated loss aversion from people’s choices between gambles mixing gains and losses. They found few usable datasets, much of the data of poor quality, and an average of 1.31, their 2024 meta-analysis reports.6 Different methods measure somewhat different things, so the estimates spread widely.
Bar chart with 4 bars; the largest is Tversky and Kahneman 1992, 25 US graduate students at 2.25.
- Tversky and Kahneman 1992, 25 US graduate students2.25
- Brown et al. 2024, 607 estimates1.96
- Brown et al. 2022 working version, bias-corrected~1.7
- Walasek et al. 2024, mixed-gamble studies1.31
Treat “twice” as a rough average across very different studies, useful for sense-checking a choice and poor at predicting your own reaction. How much a particular loss weighs on you depends on the stakes, the way the choice is put and how well you know what is being traded.
Is loss aversion real?
Loss aversion is real in many settings, but it is not a universal law of human choice. Critics have found that it fades with small stakes and argued that a pull toward the status quo explains much of it; large studies with thousands of people still find it, stronger or weaker depending on who is choosing.
The stakes matter. In Israel, Eyal Ert and Ido Erev ran experiments for real money with students; in one, with 46 participants, about half accepted a fifty-fifty bet to win or lose 10 shekels, close to what indifference predicts, while only about a fifth accepted the same bet for 100 shekels.7 Across their studies, loss aversion appeared more often when the safe option was framed as the status quo, by asking people whether they would accept a bet, than when they simply chose between two options.7 Small samples from one country limit how far this travels, but the pattern explains why some experiments find no loss aversion at all.
A coin toss with a friend over who pays for coffee feels like a game, while the same fair toss over a month’s rent feels reckless. Ert and Erev’s results suggest loss aversion often goes missing in the first kind of choice, so how you treat small bets says little about how you will treat a big one.
- Myth
- Everyone weighs every loss about twice as heavily as an equal gain.
- Fact
- The weighting varies with the stakes, the framing and what people know; with small sums of real money, some experiments find none.
The deeper challenge is about the cause. David Gal argued in 2006 that the classic findings, the refused even bet, the endowment effect and the status quo bias, all pit keeping things as they are against changing them. A plain tendency to stay put when you have no clear preference is enough to produce them, he wrote, without any special weight on losses.5 Staying on an old phone plan you never compared fits his account as well as it fits loss aversion: doing nothing is the default, so it wins ties. In 2018 Gal and Derek Rucker went further: their review found no support in the current evidence for losses being, on balance, more impactful than gains, and asked why the idea stays so widely accepted.8 In 2025 Eldad Yechiam and Dana Zeif reanalyzed part of the Brown team’s data: in studies offering gains and losses of equal size, in no particular order, the average was about 1.07, not significantly above 1, their abstract reports.9
The defenders have large samples. Kellen Mrkva, Eric Johnson, Simon Gächter and Andreas Herrmann tested loss aversion in five samples totaling 17,720 people. People at every level of knowledge and experience were loss averse, though more knowledge went with less of it; car buyers who knew a lot about fuel economy, for example, were less loss averse about fuel economy but not about comfort.10 The authors say their results cast doubt on claims that loss aversion is a fallacy or is fully explained by status quo bias.10 In Kai Ruggeri’s 2020 replication, which repeated the original questions in 19 countries with more than 4,000 participants, prospect theory’s wider patterns still held, though some came out weaker.11 That project gets a fuller treatment in our explainer on how we make decisions.
| What it is | What the best evidence found | Evidence |
|---|---|---|
| Average size across many studies | Losses outweigh equal gains on average; by less once missing low estimates are allowed for | Meta-analysis, moderate2 |
| Risky-choice studies only | A smaller average of 1.31; much of the data poor quality | Meta-analysis, limited (abstract only)6 |
| Small versus larger real stakes, Israel | Absent with 10 shekels, present with 100 | Lab experiments, limited7 |
| Status quo as the real cause | Inertia can explain the classic findings without a loss weighting | Theoretical critique, contested5 |
| Large samples and who is affected | Found at all knowledge levels, weaker with more knowledge | Five large samples, moderate (abstract only)10 |
Those conditions fit many decisions that matter, such as selling a home, leaving a job or switching suppliers, so watch for the bias where a choice is big and unfamiliar and worry less about small everyday sums.
How do you overcome loss aversion?
You overcome loss aversion mostly by changing how a choice is set up, since it depends so heavily on framing, stakes and familiarity. The steps below come from experiments, most of them in labs, so treat them as habits worth testing in your own decisions, with no promise of a fixed result.
1. Restate the choice from a neutral starting point
Ert and Erev found more loss aversion when one option was framed as staying put.7 Write both options as fresh choices instead: “keep the current supplier” and “move to the new one”, each with its costs and benefits from today. If one only looks bad because it is called a change, the frame was doing the deciding.
2. Ask whether you would buy what you already own
Owners in the mug experiments valued what they held far above what non-owners would pay.4 For anything you are reluctant to give up, such as a subscription, a piece of equipment or a project you started, ask what you would pay to get it today if you did not have it. A gap between that price and your asking price is the endowment effect at work.
3. Think of each choice as one of many
In two small 2009 lab studies in the US, Peter Sokol-Hessner, Colin Camerer, Elizabeth Phelps and colleagues taught people a perspective-taking strategy, summed up in the paper’s title as thinking like a trader. It lowered both their loss aversion and their bodily arousal to losses, the authors report.12 At work, reviewing a set of similar decisions together, such as a quarter’s hiring calls, lets one bad call be judged against the whole set.
4. Look at results less often
In a 1997 experiment with 84 students in the Netherlands, Uri Gneezy and Jan Potters found that people who saw their results after every round bet less than those who saw them every three rounds, in line with what economists call myopic loss aversion.13 The same logic suggests reviewing a long project’s numbers at set intervals, such as once a month, so each daily dip does not register as a fresh loss.
5. Learn the ground before a big, unfamiliar call
In the Mrkva team’s samples, more knowledge and experience went with lower loss aversion, an association rather than proof of cause.10 Before a large decision in unfamiliar territory, spend time learning what each option involves, from people who have made the same choice.
Run the five checks below on one decision you are facing this week.
Is loss aversion steering this decision?
The bottom line
Losses do tend to weigh more than equal gains, a little under twice as much on average, but the effect shrinks with small stakes and with familiar choices, and researchers still argue about its cause. For your next big, unfamiliar decision, write both options as fresh choices from today and ask what you would pay to get what you already have.
Frequently asked questions
Is loss aversion the same as risk aversion?
No. Risk aversion means valuing an uncertain outcome at less than its expected value, which Wikipedia's summary describes as rational behavior. Loss aversion is a bias tied to a reference point: the same situation feels worse when it is framed as a loss than as a gain. The summary warns against confusing the two, and studies measure loss aversion with choices that mix gains and losses.
Is the endowment effect the same as loss aversion?
They are linked but not identical. The endowment effect is valuing something more once you own it, shown in Kahneman, Knetsch and Thaler's 1990 coffee mug experiments, and those authors proposed loss aversion as its cause. David Gal argued in 2006 that a plain preference for keeping the status quo explains the mug results just as well, so researchers still debate how much of the effect loss aversion accounts for.
Does loss aversion change with age?
It may grow. In five samples totaling 17,720 people, Kellen Mrkva, Eric Johnson, Simon Gächter and Andreas Herrmann found older consumers were more loss averse across different measures and studies, their 2020 paper reports. Age cannot be assigned at random, so this shows a link rather than proof that ageing causes it, and the abstract does not say how large the difference was.
Sources
- Prospect Theory: An Analysis of Decision under Risk. Kahneman, D. & Tversky, A. (1979). Econometrica, 47(2), 263-291
- Meta-analysis of Empirical Estimates of Loss Aversion. Brown, A. L., Imai, T., Vieider, F. M. & Camerer, C. F. (2024). Journal of Economic Literature, 62(2), 485-516
- Loss aversion. Wikipedia (accessed 2026-11-02)
- Experimental Tests of the Endowment Effect and the Coase Theorem. Kahneman, D., Knetsch, J. L. & Thaler, R. H. (1990). Journal of Political Economy, 98(6), 1325-1348
- A psychological law of inertia and the illusion of loss aversion. Gal, D. (2006). Judgment and Decision Making, 1(1), 23-32
- A meta-analysis of loss aversion in risky contexts. Walasek, L., Mullett, T. L. & Stewart, N. (2024). Journal of Economic Psychology, 103, 102740
- On the descriptive value of loss aversion in decisions under risk: Six clarifications. Ert, E. & Erev, I. (2013). Judgment and Decision Making, 8(3), 214-235
- The Loss of Loss Aversion: Will It Loom Larger Than Its Gain? Gal, D. & Rucker, D. D. (2018). Journal of Consumer Psychology, 28(3), 497-516
- Loss aversion is not robust: A re-meta-analysis. Yechiam, E. & Zeif, D. (2025). Journal of Economic Psychology, 107, 102801
- Moderating Loss Aversion: Loss Aversion Has Moderators, But Reports of its Death are Greatly Exaggerated. Mrkva, K., Johnson, E. J., Gächter, S. & Herrmann, A. (2020). Journal of Consumer Psychology, 30(3), 407-428
- Replicating patterns of prospect theory for decision under risk. Ruggeri, K., Alí, S., Berge, M. L., et al. (2020). Nature Human Behaviour, 4, 622-633
- Thinking like a trader selectively reduces individuals' loss aversion. Sokol-Hessner, P., Hsu, M., Curley, N. G., Delgado, M. R., Camerer, C. F. & Phelps, E. A. (2009). Proceedings of the National Academy of Sciences, 106(13), 5035-5040
- An Experiment on Risk Taking and Evaluation Periods. Gneezy, U. & Potters, J. (1997). Quarterly Journal of Economics, 112(2), 631-645
How we researched this
Sources were found in November 2026 through OpenAlex, Crossref, Semantic Scholar, publisher pages and Wikipedia, starting from Kahneman and Tversky's 1979 paper and moving forward to meta-analyses, critiques and replications published up to 2025. Full texts were read for the 1979 and 1990 papers, the 2024 meta-analysis (its 2022 working version), Gal's 2006 paper, Ert and Erev's 2013 experiments and the 1997 and 2009 experiments; five sources were read only as abstracts, and nothing here goes beyond them. Main limitation: most estimates come from lab choices between money gambles, often with students.
Keep reading
Overconfidence Bias: Why We Trust Our Own Judgment More Than We Should
Overconfidence bias has 3 forms. In studies reviewed in 2008, ranges people were 90% sure of held the answer under half the time. What helps.
Hindsight Bias: Why Everything Seems Obvious After the Fact
Hindsight bias makes outcomes look predictable once you know them. Fischhoff's 1975 experiments, its three levels, and the one fix with evidence.
The Sunk Cost Fallacy Explained: Why We Stick With Choices That Aren't Working
The sunk cost fallacy lets spent money decide. A 2012 review of 166 samples found the pull shrinks when you separate it from being nearly done.
The Dunning–Kruger Effect: What It Really Says and What It Doesn't
The 1999 Dunning-Kruger paper never drew 'Mount Stupid'. Statistics explain part of its pattern, but two 2021 studies of about 4,000 people each found a gap.