Overconfidence Bias: Why We Trust Our Own Judgment More Than We Should
Overconfidence bias has 3 forms. In studies reviewed in 2008, ranges people were 90% sure of held the answer under half the time. What helps.

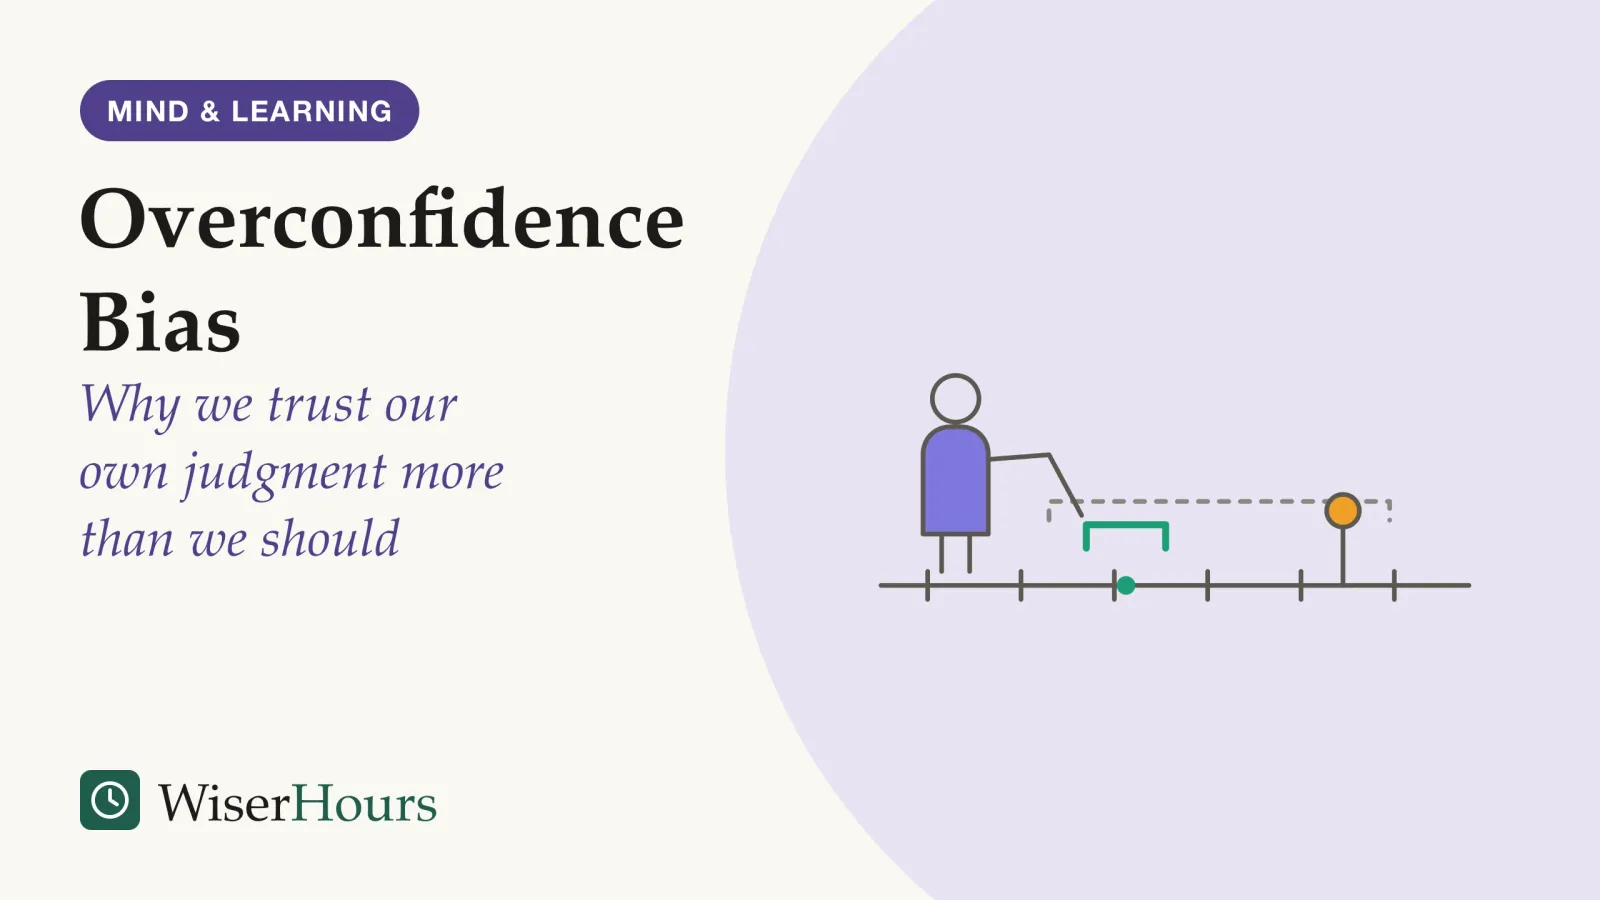
In lab tests, most ranges that people call 90 percent certain miss the truth. Across the studies Don Moore and Paul Healy reviewed in 2008, ranges people were 90 percent sure would contain a true figure, such as the length of the Nile, held the right answer less than half the time.1 That miss is overconfidence bias in its plainest form.
Overconfidence bias is the gap between how sure people are of a judgment and how often that judgment proves right. Moore and Healy split it into three forms: overestimating your own performance, placing yourself above other people, and being too sure of your estimates. The third form, overprecision, shows up most reliably.1 It belongs to the wider set of common cognitive biases that skew decisions. The best-tested checks are small habits: ask for your lowest and highest figures separately, start from how similar cases turned out, and write down how sure you were.
What are the three types of overconfidence bias?
Overconfidence covers three separate errors, Moore and Healy argued in their 2008 Psychological Review paper: overestimation (believing you did better than you did), overplacement (believing you did better than others) and overprecision (being too sure your estimate is right). Earlier research had often treated them as interchangeable.1
The split matters because the three can move in opposite directions. The most popular test of the bias, asking how sure people are of each quiz answer, blends overestimation and overprecision, Moore and Healy pointed out, so one “overconfidence” score can hide which error is at work.1
A project lead planning a product launch can commit all three in one meeting. “We’ll be ready by the 30th” overestimates the team’s pace. “We move faster than the other product teams” overplaces it. “The last Friday, give or take a day” is overprecision: even if that Friday is a fair middle guess, a one-day margin on a months-long project leaves no room for the delays such projects often hit.
- Overestimation: thinking you did better than you did, or will do better than you will
- Overplacement: thinking you did better than other people did
- Overprecision: being too sure your estimate is right, so the range you give is too narrow
The broader “overconfidence effect”, confidence running ahead of accuracy, has been blamed for lawsuits, strikes, wars, failed corporate takeovers and stock market bubbles.2
When you notice you feel sure, name which claim you are making: about your result, your rank or your range. Each one is checked against something different: your own track record, other people’s results, or how often ranges like yours have held.
Overconfidence bias examples: drivers, juggling and trading
The most quoted example comes from Ola Svenson’s 1981 survey of student drivers.3 In it, 93 percent of a US sample and 69 percent of a Swedish sample rated themselves more skillful than the median driver in their own country, and more than half of any group cannot sit above its median.1
The study has real limits. It surveyed 161 students and relied on their own ratings, with no test of how they drove.4 Each person could also judge “skill” by their own definition, one careful and another fast, and later experiments found the better-than-average effect grows when people are free to interpret the trait and shrinks, without vanishing, when the trait is tightly defined.4
The driving result also depends on the task feeling easy. In 1999 Justin Kruger found that people rate themselves above average where most people are skilled, but below average where skills tend to be low; he traced the pattern to people focusing on their own skill and giving too little thought to everyone else’s.5 Moore and Healy give juggling and riding a unicycle as examples of hard tasks where people routinely rank themselves below average.1
- Myth
- Everyone thinks they are above average at everything.
- Fact
- On skills most people find hard, such as juggling, people tend to rank themselves below average. The above-average effect belongs mostly to easy, familiar tasks.
Money gives a costly example. In tens of thousands of US brokerage accounts from 1991 to 1997, men traded 45 percent more than women, Brad Barber and Terrance Odean reported, and the trading lowered both groups’ net returns; the economists used gender as a stand-in for overconfidence rather than measuring it.6
Ask a sales team who has the best client relationships and most hands go up, because the task feels easy and nobody watches the others’ calls; ask who could present to the board in a foreign language and most eyes drop. Before you trust a “better than most” feeling, ask whether the task feels easy to you; ease tends to inflate your rank and difficulty deflates it.
Why people overrate their score on hard tasks and their rank on easy ones
Task difficulty pushes overestimation and overplacement in opposite directions, Moore and Healy found: on hard quizzes people overestimated their own score yet believed they had done worse than others, and on easy quizzes they underestimated their score yet believed they had beaten others.1
The study
Moderate evidence
Easy quizzes, hard quizzes: Moore and Healy's paid-estimate experiment
Students each took a series of short trivia quizzes, some easy and some very hard, and estimated both their own score and that of a randomly chosen earlier participant, with money paid for accurate estimates. On hard quizzes they overestimated their own score but placed themselves below the other person; on easy quizzes they did the opposite. They were also, on average, 73 percent sure of their exact score after each quiz and right 59 percent of the time.1
The authors’ explanation does not require vanity. People get an imperfect signal of how well they did and an even weaker one about everyone else, so both estimates get pulled back toward what they expected before the quiz, and the estimate of others is pulled back further.1
- 1An expectationbefore the quiz, you expect a middling score
- 2A hazy signal about youyou sense how it went, imperfectly
- 3A hazier signal about othersyou barely know how they did
- 4Both pulled toward the expectationthe guess about others more strongly
On a brutal quiz you expect a middling score, so you guess too high for yourself, higher still for others, and end up ranking yourself below them.
The study is one lab sample of 82 students answering trivia, so treat its pattern as a well-argued model that still needs testing outside the lab. The same people showed overprecision consistently from quiz to quiz, while their overestimation and overplacement shifted with each quiz.1
A candidate leaving a hard case interview often concludes they did badly against the other applicants, while still overrating how many parts of the case they solved. Both errors come from knowing too little about how everyone else did.
Overprecision is the most reliable form of overconfidence
Uri Haran, Don Moore and Carey Morewedge described overprecision as the most dependable type of overconfidence in a 2010 paper, and they note it appears in expert judgments as well as novice ones.7 Its standard test is the range question: give a low and high figure you are 90 percent sure brackets the truth.
Jack Soll and Joshua Klayman tested why those ranges miss so often in 2004 experiments. Part of the miss is noise, ranges that vary in width by accident. The main cause was bias: ranges were systematically too narrow, sometimes only about 40 percent as wide as good calibration needed. How the question was asked changed the result a great deal, as did the subject matter and whether the judge was a man or a woman.8
The likeliest mechanisms, as Moore and Healy summarized them, are anchoring on a first guess and adjusting too little, and searching mainly for reasons the guess is right.1 A contractor asked how long a kitchen renovation will take thinks of the usual schedule, says “five to six weeks”, and never pictures the late delivery or the wiring surprise that a wider range would have covered.
Overprecision matters for plans as much as quizzes. Budgets, launch dates and staffing all rest on ranges, and a range that is too narrow makes every plan built on it look safer than it is. When you give a range, make it wider than feels comfortable, then check it with the steps below.
Overconfidence and Dunning-Kruger: a broad bias and a narrower claim
Overconfidence and the Dunning-Kruger effect are different claims. Overconfidence is the broad tendency to be surer than the evidence allows, in any of its three forms. Dunning and Kruger’s finding concerns how errors in self-assessment change with skill: the weakest performers overrate themselves the most. Moore and Healy’s account predicts part of that pattern on its own: if self-estimates are pulled toward what people expected, those who score lowest will overestimate themselves and those who score highest will underestimate themselves.1 Whether anything remains beyond that statistical pull is still debated; our guide to what the Dunning-Kruger effect says and what it doesn’t sets out both sides.
A trainee who scores lowest on a first assessment and still calls the work solid fits both labels at once. Either way the remedy is the same: compare the feeling with a record of how you have done before.
Five ways to reduce overconfidence bias
The corrections with the best evidence come from forecasting tournaments and lab experiments on estimates; none has been tested on everyday workplace decisions over years. In rough order of evidence:
- Keep score of how sure you were
- Start from how similar cases turned out
- Give your low and high estimates separately
- Argue against your own answer
- Run a premortem before a plan goes ahead
1. Keep score of how sure you were
Write a probability next to predictions you care about (“70 percent the client signs by June”), then check later how often your 70 percent calls came true. In a geopolitical forecasting tournament funded by US intelligence research agency IARPA, thousands of forecasters predicted hundreds of world events over three years. Their confidence roughly matched their accuracy, with a small amount of overconfidence, about 3 percent, especially on their most confident forecasts. Training and teamwork together cut it to about 1 percent.9 Unless you write predictions down and score them, you cannot learn whether your 70 percent means 70 percent.
2. Start from how similar cases turned out
Ask first how often projects, hires or bets like yours have worked out, and only then think about what makes yours different. That habit of starting from a base ratebase rate: How often something happens in general, across all similar cases, before you know anything special about your own. Judgments that ignore it, a mistake called base-rate neglect, tend to be too confident about the case in front of them.Full entry in the glossary was part of the training module used in that tournament series, which lasted less than an hour and improved accuracy by 6 to 11 percent over untrained forecasters across four years; the same agency paid for that study.10 Our guide to how we make decisions covers reference classes in general. For overconfidence, their value is a starting range taken from real outcomes instead of from your own first guess.
3. Give your low and high estimates separately
Ask “what is the lowest figure I can believe?” and “what is the highest?” as two separate questions. Soll and Klayman found that the way a range is requested makes a large difference to how often it holds, and splitting the request into separate judgments was the better way to ask.8 Haran and colleagues went further: 103 Pittsburgh residents assigned a probability to every band of possible temperatures a month ahead, and those estimates caught the true high temperature 88 percent of the time, close to the 90 percent target, against 74 percent for ordinary 90 percent ranges.7
For a project, that means writing down the chance of finishing in each block of time (this month, next month, the month after, later) before naming a date. The share you give to “later” is often the warning.
4. Argue against your own answer
Before settling on a confidence level, list the reasons you could be wrong. In experiments by Asher Koriat, Sarah Lichtenstein and Baruch Fischhoff, described by Haran and colleagues, people asked to consider evidence against their chosen answer reported lower confidence.7 Haran and colleagues also note that attempts to debias overprecision have had limited success, so expect this step to take the edge off your certainty and little more.7
5. Run a premortem before a plan goes ahead
In a premortem, described by Gary Klein in a 2007 Harvard Business Review article, the team imagines the project has already failed and lists plausible reasons why.11 Klein’s aim is to make it safe for people to voice reservations they would otherwise keep to themselves during planning.11 The method has far less experimental testing behind it than the steps above.
Five checks on an estimate that matters
| Finding or fix | Result in the research | Strength of evidence |
|---|---|---|
| Ranges set too narrow (overprecision) | 90 percent ranges held the answer less than half the time across the studies reviewed | Many lab studies agree, moderate1 |
| Difficulty flips estimate and rank | Hard quizzes raised self-estimates and lowered self-rank; easy quizzes did the reverse | One lab study of 82 US students, moderate1 |
| Separate low and high estimates | Asking for separate judgments gave less overconfidence than asking for a range at once | Lab experiments with students in the US and France, moderate8 |
| Probabilities for every band of outcomes | Caught the answer close to the 90 percent target in an online study of 103 adults | Within-person experiments, moderate7 |
| Training and teamwork | Small overconfidence fell further with training and teamwork in a 3-year tournament | Large field study, moderate9 |
| Premortem | Proposed in a 2007 Harvard Business Review article to surface doubts before a project starts | Expert opinion, limited11 |
The bottom line
Overconfidence bias is mostly a problem of ranges drawn too tight: people are surer of their estimates than their track record allows, and that form holds up better than claims that everyone thinks they are above average. Before a forecast or a deadline that matters, ask for your lowest and highest believable figures as two questions, then write down how sure you are so you can check later whether your 80 percent calls come true about 80 percent of the time.
Frequently asked questions
Do experts suffer from overconfidence too?
Yes. Uri Haran, Don Moore and Carey Morewedge noted in 2010 that ranges set too narrow appear in expert judgments as well as novice ones, citing earlier studies of both groups. Knowing a field well does not protect a forecast from being too precise, so a specialist's confident estimate still deserves a check against how often similar estimates came true.
Are men more overconfident than women?
In some studies, on some tasks. Jack Soll and Joshua Klayman's 2004 experiments found substantial differences between male and female judges in how overconfident their estimate ranges were, and Brad Barber and Terrance Odean linked heavier trading by men in 1990s US brokerage accounts to overconfidence. Both describe group averages in particular samples and cannot tell you how sure any individual man or woman will be.
What is the hard-easy effect?
The hard-easy effect is the finding that people tend to overestimate their own performance on difficult tasks and underestimate it on easy ones. Moore and Healy's 2008 paper adds a twist: the same hard tasks make people rank themselves below others, while easy ones make them rank themselves above others.
Sources
- The trouble with overconfidence. Moore, D. A. & Healy, P. J. (2008). Psychological Review, 115(2)
- Overconfidence effect. Wikipedia, accessed October 2026
- Are we all less risky and more skillful than our fellow drivers? Svenson, O. (1981). Acta Psychologica, 47(2)
- Illusory superiority. Wikipedia, accessed October 2026
- Lake Wobegon be gone! The "below-average effect" and the egocentric nature of comparative ability judgments. Kruger, J. (1999). Journal of Personality and Social Psychology, 77(2)
- Boys will be boys: Gender, overconfidence, and common stock investment. Barber, B. M. & Odean, T. (2001). Quarterly Journal of Economics, 116(1)
- A simple remedy for overprecision in judgment. Haran, U., Moore, D. A. & Morewedge, C. K. (2010). Judgment and Decision Making, 5(7)
- Overconfidence in interval estimates. Soll, J. B. & Klayman, J. (2004). Journal of Experimental Psychology: Learning, Memory, and Cognition, 30(2)
- Confidence calibration in a multiyear geopolitical forecasting competition. Moore, D. A., Swift, S. A., Minster, A., et al. (2017). Management Science, 63(11)
- Developing expert political judgment: The impact of training and practice on judgmental accuracy in geopolitical forecasting tournaments. Chang, W., Chen, E., Mellers, B. & Tetlock, P. (2016). Judgment and Decision Making, 11(5)
- Performing a project premortem. Klein, G. (2007). Harvard Business Review, September 2007
How we researched this
Crossref, OpenAlex, PubMed and Wikipedia were searched in October 2026, beginning with Moore and Healy's 2008 review and tracing its references and later forecasting-tournament reports. Moore and Healy, Soll and Klayman, Haran and colleagues, Chang and colleagues, and Barber and Odean were read in full (three as the authors' manuscripts); Kruger, Moore and colleagues and Klein were read as an abstract or summary, and Svenson's figures come from Moore and Healy. Main limitation: most of the studies used short quizzes taken by US students.
Keep reading
Loss Aversion: Do Losses Really Loom Larger Than Gains?
Loss aversion makes a loss sting more than an equal gain pleases. Evidence since 1979 says it is real on average, but weak or absent when stakes are small.
Hindsight Bias: Why Everything Seems Obvious After the Fact
Hindsight bias makes outcomes look predictable once you know them. Fischhoff's 1975 experiments, its three levels, and the one fix with evidence.
The Sunk Cost Fallacy Explained: Why We Stick With Choices That Aren't Working
The sunk cost fallacy lets spent money decide. A 2012 review of 166 samples found the pull shrinks when you separate it from being nearly done.
The Dunning–Kruger Effect: What It Really Says and What It Doesn't
The 1999 Dunning-Kruger paper never drew 'Mount Stupid'. Statistics explain part of its pattern, but two 2021 studies of about 4,000 people each found a gap.