Bear Markets Explained: What They Are and How Long They've Lasted Historically
A bear market is usually a fall of 20% or more, a convention rather than a rule. US bear markets since 1929 fell for 1 month to about 2.5 years.

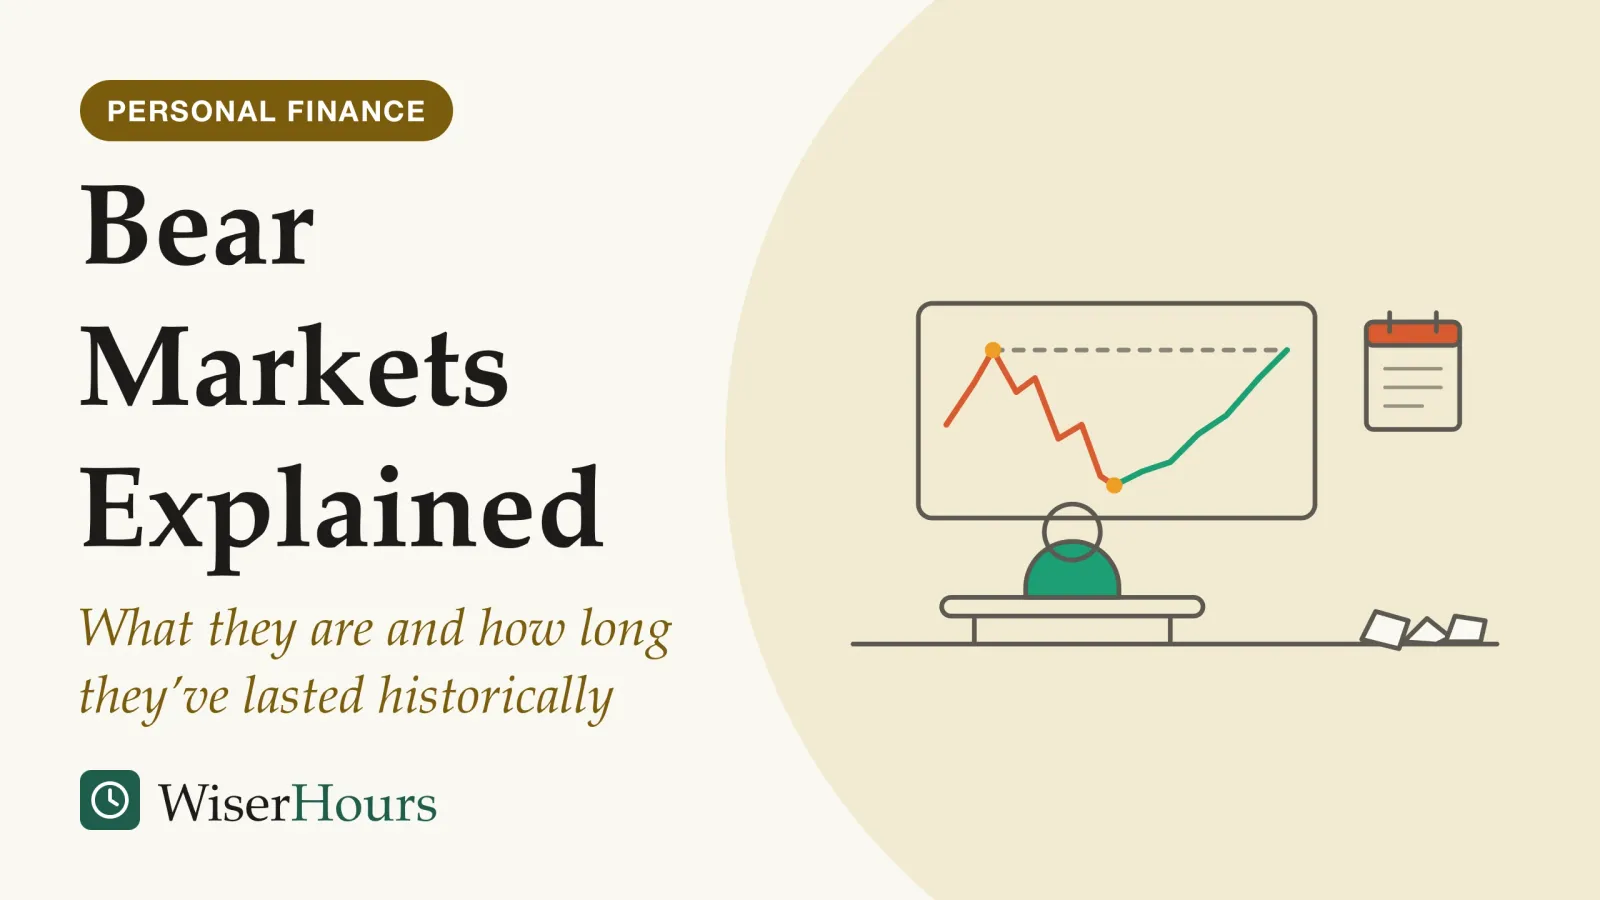
A bear market is a long, broad fall in prices, usually defined as a drop of 20 percent or more in a broad market indexmarket index: A defined list of securities, such as the shares of a country's largest companies, whose prices are combined into one number to show how that part of the market is doing. The index itself cannot be bought; funds that copy it charge costs.Full entry in the glossary from its last high. The US Securities and Exchange Commission (SEC) adds that the fall generally lasts at least two months.1 The number is a habit of the industry, not a fixed rule. Since 1929 US bear markets in the S&P 500 have taken from about one month to about two and a half years to reach bottom, and the index has needed from six months to a quarter of a century to regain its old high.2
Definition
A bear market is a period when prices across a market fall a long way and keep falling. By convention, it starts when a broad index closes 20% or more below its latest high, and it is measured from that peak to the lowest point.
The practical use of that record is a test you can run on your own plans while prices are calm: if the stocks you hold fell by half and took years to recover, which of that money could you still leave alone? This page explains the label and the history behind it. The basics of stocks and funds are in the WiserHours plain-language introduction to investing, and nothing here is a recommendation to buy or sell.
The 20 percent line is a habit, not a rule
The 20 percent threshold is one the investment industry has settled on by custom. FINRA, the self-regulatory body for US brokers, says a fall of 20 percent or more in a broad index “generally” meets it, and applies the word to bond indexes and commodities too.3 Neither definition cites a law behind the number or names a body that declares when a bear market starts or ends.
Because the line is a convention, the details depend on who does the counting. Ned Davis Research, whose figures the US fund company Hartford Funds publishes, starts a new bull market once prices climb a fifth off a low. It counts 27 bear markets in the S&P 500 since 1928, splitting the slides of the early 2000s and of 2007 to 2009 into two each.4 Yardeni Research, an independent firm that sells its analysis to investment professionals, lists each of those slides as one.2
The line also sorts near-identical events into different boxes. In late 2018 the S&P 500 fell 19.8 percent in about three months and was never called a bear market; in 2022 it fell about a quarter and was. Yardeni’s tables file the 2018 slide under corrections, the name FINRA gives to a reversal of at least 10 percent before prices resume their trend.23 For someone holding the index, the gap between the two was about 6 percentage points of loss, not a difference in kind.
Treat “bear market” as a headline word, not as a measure of your own risk. A fall that stops just short of the line can cost nearly as much as one that crosses it.
A falling market is not a shrinking economy
A bear market describes prices in a stock market; a recession describes the whole economy. In the US, recessions are dated by the Business Cycle Dating Committee of the National Bureau of Economic Research (NBER), which looks for a significant decline in economic activity that is spread across the economy and lasts more than a few months. The committee weighs figures such as jobs, income and production, and it names turning points months after they happen, once it is confident a recession has occurred.5 Stock indexes, by contrast, are priced every trading day, so the market’s label can come first.
The two often arrive together, but not always. The 1987 crash was a bear market with no US recession: the NBER’s chronology shows none between late 1982 and the middle of 1990. The 2022 bear market also came without a recession, as of the NBER’s last update in 2023 of its dates.6 The reverse happened in 1990: the NBER dates a recession from that July to the following March, yet Yardeni’s tables show the S&P 500 falling just short of the line that year.62
- Myth
- A bear market means a recession has started.
- Fact
- A bear market is a fall in stock prices; a recession is a broad decline in the economy. In the US, the 1987 and 2022 bear markets came without an NBER-dated recession.
When a news alert says stocks have entered a bear market, it reports what prices did. It says nothing certain about what the economy is doing or will do next, and it is not a forecast for jobs or pay.
How long US bear markets have lasted, and how long recovery took
US bear markets have ranged from about a month to several years from peak to low, and the climb back to the old high has usually taken longer than the fall. The table rebuilds figures from Yardeni Research’s tables of S&P 500 closing prices, which the firm credits to Standard and Poor’s.
| Bear market | Fall, peak to low | Time falling | Time from old peak to a new closing high |
|---|---|---|---|
| 1929 to 1932 (two bear markets joined) | about 86% | about 33 months, with a rally between | about 25 years (September 1954)2 |
| 1973 to 1974 | about 48% | about 21 months | about 7.5 years (July 1980)2 |
| 1987 | about 34% | about 3 months | about 2 years (July 1989)2 |
| 2000 to 2002 | about 49% | about 31 months | about 7 years (May 2007)2 |
| 2007 to 2009 | about 57% | about 17 months | about 5.5 years (March 2013)2 |
| 2020 | about 34% | about 1 month | about 6 months (August 2020)2 |
| 2022 | about 25% | about 9 months | about 2 years (January 2024)2 |
Selected bear markets in the S&P 500 (an index of large US companies) as a price index in US dollars, not adjusted for inflationinflation: A general rise in the prices of goods and services over time, so that the same amount of money buys less. Returns are often reported after inflation, in real terms, to show what a gain is worth in buying power.Full entry in the glossary or dividends. The first row joins two slides that Yardeni lists separately and is our arithmetic from its index levels, so its time falling is longer than any single bear market in Yardeni’s list.
The table runs two clocks, and they tell different stories. The fall can be quick, as in the 1987 and 2020 crashes. The way back takes longer because losses and gains do not cancel evenly. An illustrative US$10,000 that halves to US$5,000 must then double, gaining 100 percent, just to get back to where it started. That arithmetic is one reason the three rows with falls of about half or more (1973 to 1974, 2000 to 2002 and 2007 to 2009) took years longer to repair than to happen.
S&P Dow Jones Indices runs the S&P 500 and keeps its own count of bear markets over the index’s whole life. It is paid to license its indexes to other firms, whose funds and other products can be based on them, though it does not sell funds itself.7
The study
Moderate evidence
Twelve bear markets in the S&P 500's live history
The index went through 12 bear markets over its live history, with an average fall of 33% from peak to low. The bull markets between them lasted about five years on average and gained about 160%.7
The count is complete for one index, which is its strength, but it covers one country’s largest companies, and one country’s past cannot show what happened elsewhere. The brochure carries the warning that past performance is no guarantee of future results. Its figures also show dividends adding roughly 3 percentage points a year to the index’s return since the 1957 launch, so an investor who reinvested them got back to even sooner than the table shows.7 Inflation pulls the other way: measured in buying power, many waits were longer.
For planning, the second clock matters more than the first. For money held in stocks, the useful question is not only how far prices could fall but whether you could leave that money alone for as long as the slowest recoveries took.
Wars, oil shocks and slumps: the wider record since 1900
A long international record of market falls is UBS’s Global Investment Returns Yearbook. In its 2026 edition, London Business School’s Paul Marsh and Mike Staunton and Cambridge University’s Elroy Dimson cover 35 countries back to 1900; UBS, a bank that sells investment products, publishes it without peer reviewpeer review: The checking of a study by independent experts, usually arranged by a journal, before it is accepted for publication. It screens for weak methods and unclear reporting, but reviewers rarely see the raw data, so passing it does not prove a finding is right.Full entry in the glossary. The public summary records that stocks and bonds have several times fallen by over 70 percent in real terms, meaning after inflation.8
The causes vary, and that matters more than any single number. By the summary’s count, the two world wars and the 1973 to 1974 oil shock, all geopolitical events, account for three of the six worst episodes for large global stock markets since 1900, while three of the four largest peacetime bear markets had economic triggers. It adds that in its data a mix of three parts stocks to two parts bonds never declined by more than half.8 How spreading money softens falls is covered in the explainer on why diversification reduces risk.
The US table is one country’s history, and the next shock need not resemble the last. A plan that could survive a fall deeper and longer than any in the table is sturdier than one built on the average fall.
Four questions to put to your plans before prices fall
The history is most useful as a test of plans made while markets are calm, not as a signal to act on once prices drop. The questions below are for understanding your own position; they are not advice to buy or sell anything.
Before the next fall
- Which of the money I hold in stocks might I need within the next few years?
- If my stocks fell by about half, as US stocks did in 1973 to 1974 and again in 2000 to 2002 in the table, what would I have to sell, and when?
- Could I leave that money untouched for as long as the slowest recoveries in the table took?
- Am I judging the worst case by the US record alone, or by the longer global one?
The answers depend on your income, your debts and when you need the money, which no table can know. Someone whose house deposit sits in a stock fund answers the first question differently from someone saving for retirement decades away.
The past sets a range, not a timetable
Past performance does not guarantee future results, and bear markets show why. The SEC puts it plainly in its guidance on funds: past performance does not predict future returns, though it can show how volatile an investment has been.9
The history is too varied to work as a schedule. Hartford Funds, a US fund company drawing on Ned Davis Research, puts the average US bear market since 1928 at about 9.6 months.4 The average hides the range. Anyone who expected the 2020 fall to run like the one that began in 2000 would have been wrong by years: the 2000 slide lasted more than two and a half years in Yardeni’s count, while the 2020 index was back at its old high by that August.2
One academic study points the same way. In a 2003 paper in the Journal of Applied Econometrics, Adrian Pagan and Kirill Sossounov dated bull and bear markets with a formal rule, and their abstract reports that a pure random walk, a model in which each move is unrelated to the last, explained those markets as well as more complex statistical models did.10 We read only the abstract, so we report no more than that. If swings like these can arise by chance, past bear markets are a weak guide to when the next one starts.
Regulators draw the same line. The UK’s Financial Conduct Authority (FCA) warns that trying to time the market increases your risk of buying or selling at the wrong time, and suggests investing over at least five years.11 What to do while prices are falling is a separate question for its own WiserHours guide; this page stops at what bear markets are and how they have behaved.
Before you trust anyone’s advice in a falling market
When prices fall, confident advice is easy to find, so it pays to check who is giving it before acting. The steps below are grouped by timing; the checks come from the US and UK regulators named, and the timing is this article’s suggestion.
- Now, before acting on any recommendation: confirm whoever is advising you holds a license. The SEC’s advice to US investors is to look up the background of every financial professional to confirm they are licensed, and Investor.gov offers a search tool for it.12 The FCA’s Firm Checker shows UK investors whether a firm has the regulator’s authorization and permission for what it is offering them.13 In other countries, look up the regulator that licenses investment firms where you live.
- Soon, if money you will need within a few years is in stocks, or a fall would force you to sell: a regulated or fee-only adviser is able to look at income, debts and tax together, which a page of market history cannot.
- Once a year, while markets are calm: go back to the four questions above and see whether your answers still hold.
The bottom line
The 20 percent line that defines a bear market is an industry habit rather than a rule, and it measures prices, not the economy. In the US record since 1929 the falls have lasted from about a month to about two and a half years, and regaining the old high has taken from months to decades. That history can show how deep and long a fall your plans should be able to survive; it cannot tell you when the next one will come.
This article is general education, not financial advice. For decisions about your own money, speak to a qualified, regulated adviser.
Frequently asked questions
Who decides when a bear market starts or ends?
No regulator's definition names anyone. The SEC and FINRA say only what generally counts, a 20 percent fall in a broad index, and data firms apply their own rules to index prices. So counts differ: Ned Davis Research, whose figures the US fund company Hartford Funds publishes, lists 27 US bear markets since 1928, while Yardeni Research, an independent research firm, lists fewer by treating some back-to-back slides as one.
Do bear markets apply to bonds, gold or crypto too?
The label can apply to any market whose price falls far enough. FINRA, the US brokerage industry's self-regulatory body, says a stock or bond index, or a commodity's price, is in a bear market when it falls and keeps falling, with a 20 percent decline in a broad index the usual threshold. Most published histories, including the one on this page, cover stock indexes only.
What is the opposite of a bear market?
A bull market, a long rise in prices. S&P Dow Jones Indices, the company behind the S&P 500, dates one from a 20 percent rise off a low, the mirror image of its bear market rule. Hartford Funds, a US fund company citing Ned Davis Research, puts the average US bull market since 1928 at about 2.7 years, against about 9.6 months for bear markets: a record of the past, not a forecast.
Sources
- Bear Market (glossary). US Securities and Exchange Commission, Investor.gov, accessed 24 September 2026
- Stock Market Historical Tables: Bull & Bear Markets. Yardeni Research, Inc. (21 January 2024); S&P 500 data from Standard & Poor's
- Key Terms for Tough Times: The Vocabulary of Stressed Markets. FINRA (US), Investor Insights, 3 June 2025
- 10 Things You Should Know About Bear Markets. Hartford Funds (a US fund company), 2025; data from Ned Davis Research, as of December 2024
- Business Cycle Dating. National Bureau of Economic Research (US), Business Cycle Dating Committee, accessed 24 September 2026
- US Business Cycle Expansions and Contractions. National Bureau of Economic Research (US), data last updated 14 March 2023
- S&P 500: The Gauge of the U.S. Large-Cap Market. S&P Dow Jones Indices (2025), data as of 30 June 2025
- Global Investment Returns Yearbook 2026: public summary edition. Dimson, E., Marsh, P. & Staunton, M. (2026). UBS
- Mutual Funds. US Securities and Exchange Commission, Investor.gov, accessed 24 September 2026
- A simple framework for analysing bull and bear markets. Pagan, A. R. & Sossounov, K. A. (2003). Journal of Applied Econometrics, 18(1)
- The golden rules of investing. Financial Conduct Authority (UK), InvestSmart, last updated 19 January 2026
- Check Out Your Investment Professional. US Securities and Exchange Commission, Investor.gov, accessed 24 September 2026
- How to check a firm or individual is authorised. Financial Conduct Authority (UK), last updated 22 September 2026
How we researched this
In September 2026 we read the SEC's and FINRA's definitions, S&P Dow Jones Indices' S&P 500 brochure (data to June 2025), Yardeni Research's tables of S&P 500 bear markets (January 2024), Hartford Funds' summary of Ned Davis Research data, the NBER's business cycle dates, the public summary of the 2026 UBS Global Investment Returns Yearbook and the abstract of one peer-reviewed paper. Main limitation: the figures are past US price-index data and cannot predict future markets.
Keep reading
The Behavior Gap: How Investors End Up Earning Less Than Their Own Funds
Fund investors often earn less than their funds report. How the behavior gap is measured, why estimates range from about 8.5 points to 0.1, and what to do.
Dollar-Cost Averaging vs. Lump Sum: What the Research Says
Dollar-cost averaging vs lump sum: why investing each paycheck is a different question, and what Vanguard and research since 1979 found about windfalls.
Diversification Explained: Why Spreading Your Money Reduces Risk
Diversification explained: why spreading cuts one company's risk but not the market's, and why one US study found the stocks needed rose from about 20 to 50.
What Is an Index Fund? How Tracking a Market Index Works
An index fund copies a market index instead of trying to beat it. How tracking works, why the copy is never exact, and 5 questions to ask before you buy.