Stay the course · Lesson 10 of 11
When Markets Fall: Bear Markets and Staying Calm
Learn what a correction and a bear market are, how long recoveries have taken, and how to write a calm plan before a fall.
 Video coming soon
At some point, your investments will fall, sometimes a lot. In this lesson you will see how often that happens, how long recoveries have taken, and how to stay calm when it does. The figures are past US results. They show a range of what has happened, not what will happen.
The words for a fall
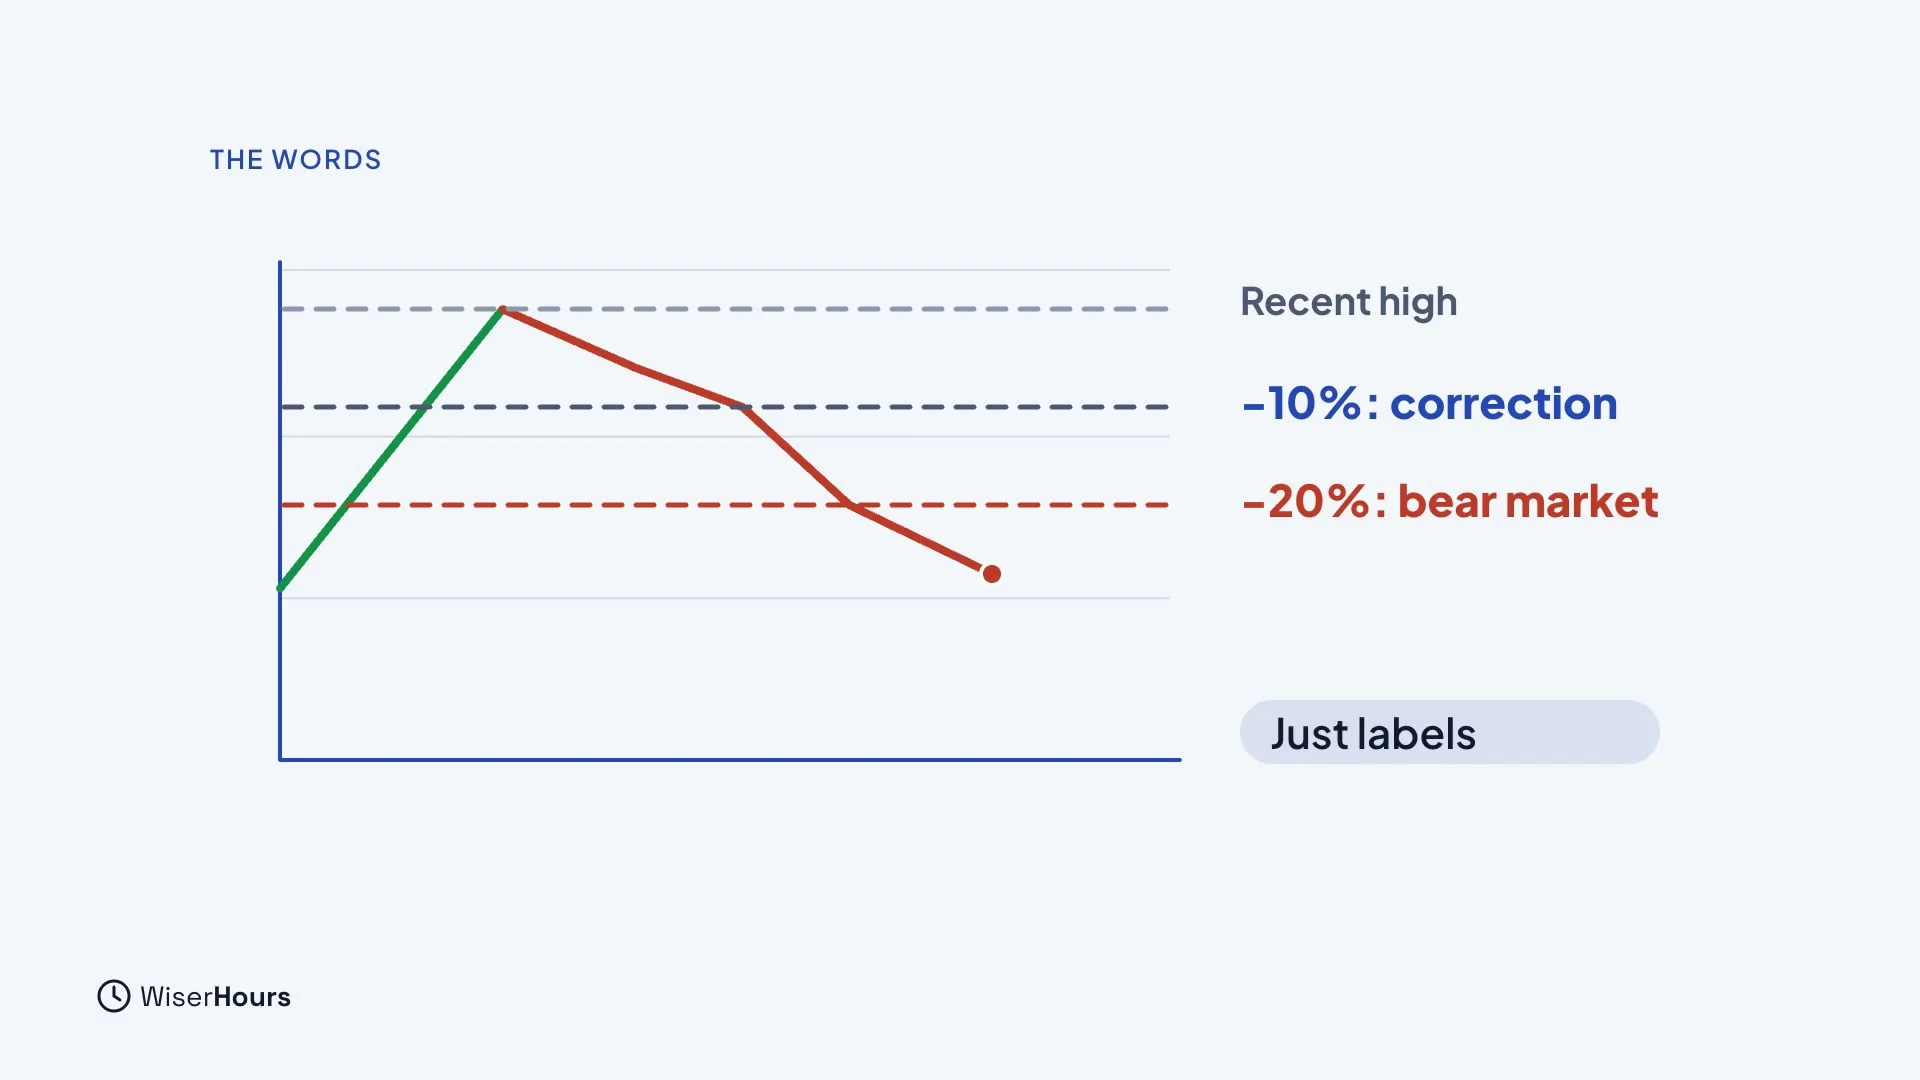
A drop of 10 percent or more from a recent high is called a correction. A fall of 20 percent or more is usually called a bear market. These are just labels, and nobody officially declares them.
 (opens the full-size picture)
Falls are normal
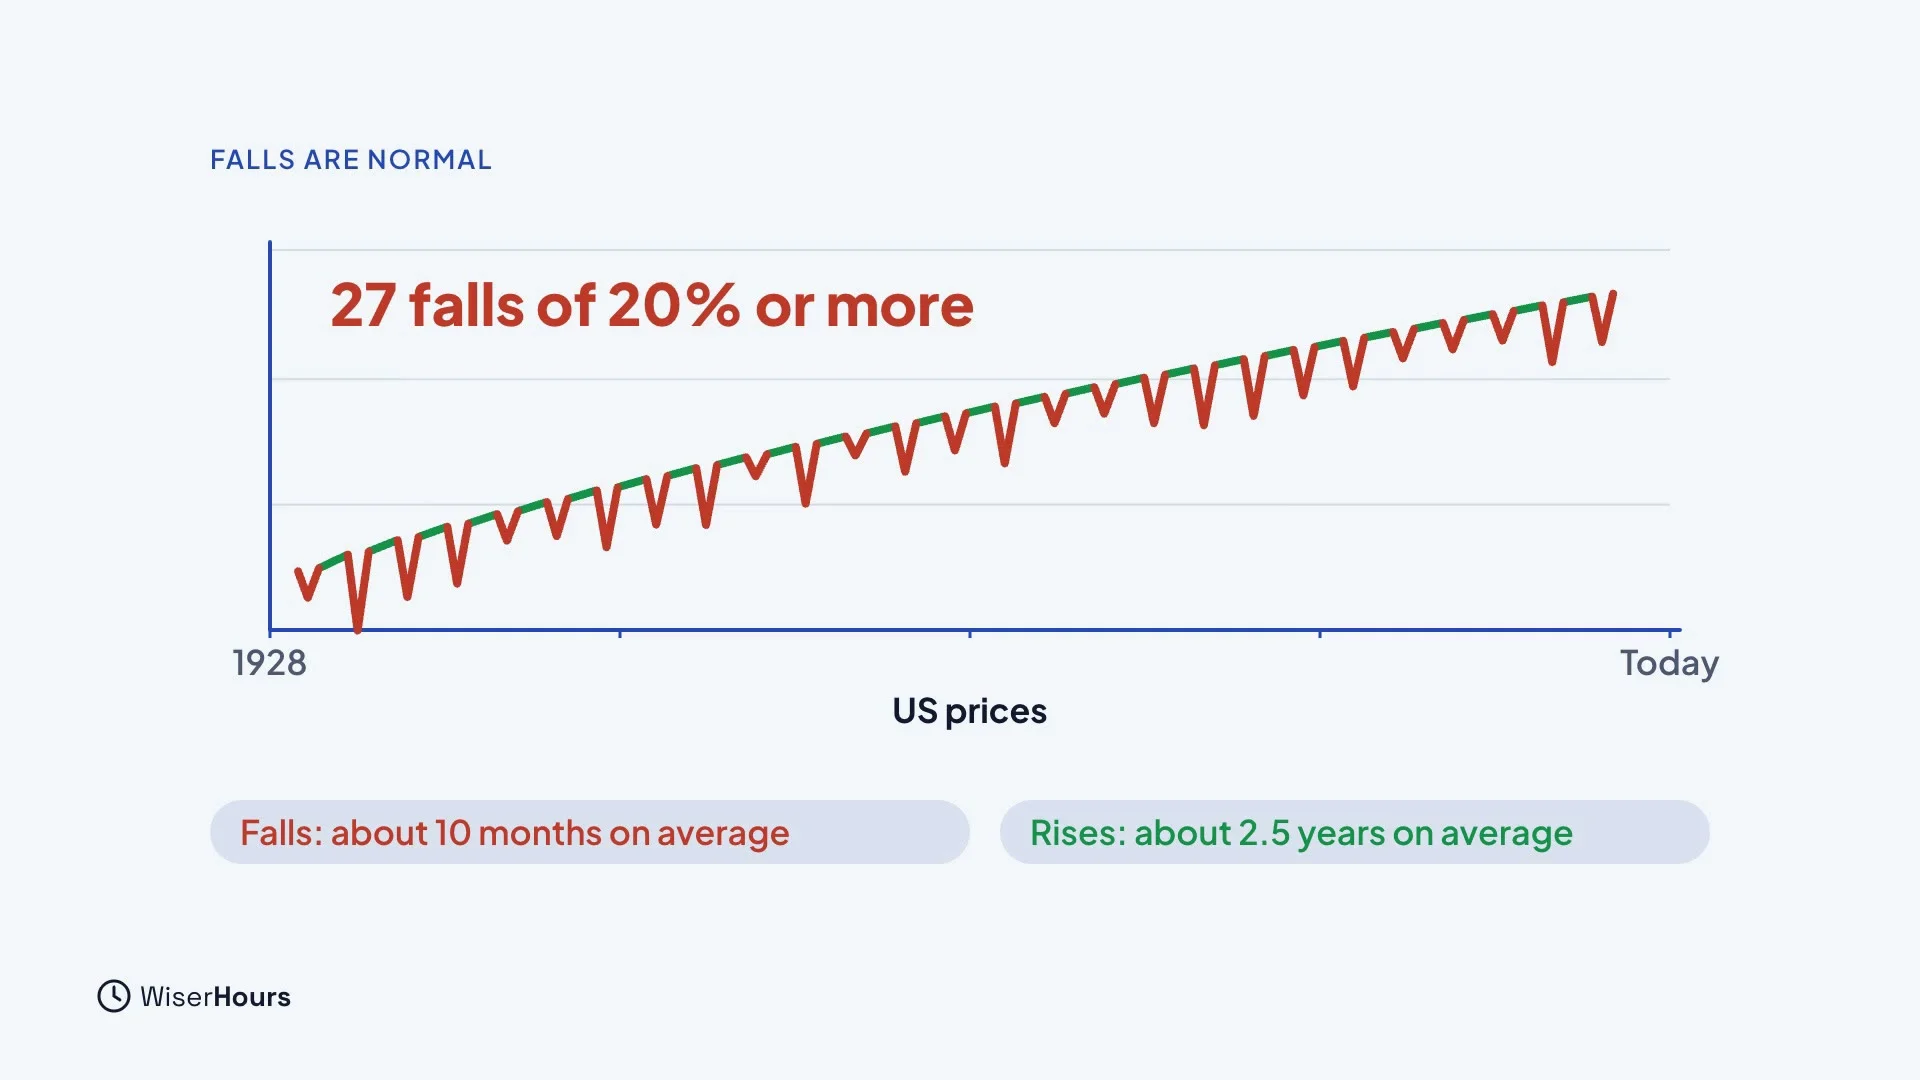
Bear markets are a normal part of investing. One count finds 27 of them in the US since 1928. On average, they have lasted about ten months. The rises in between have lasted much longer, about two and a half years on average.
 (opens the full-size picture)
How long recoveries took
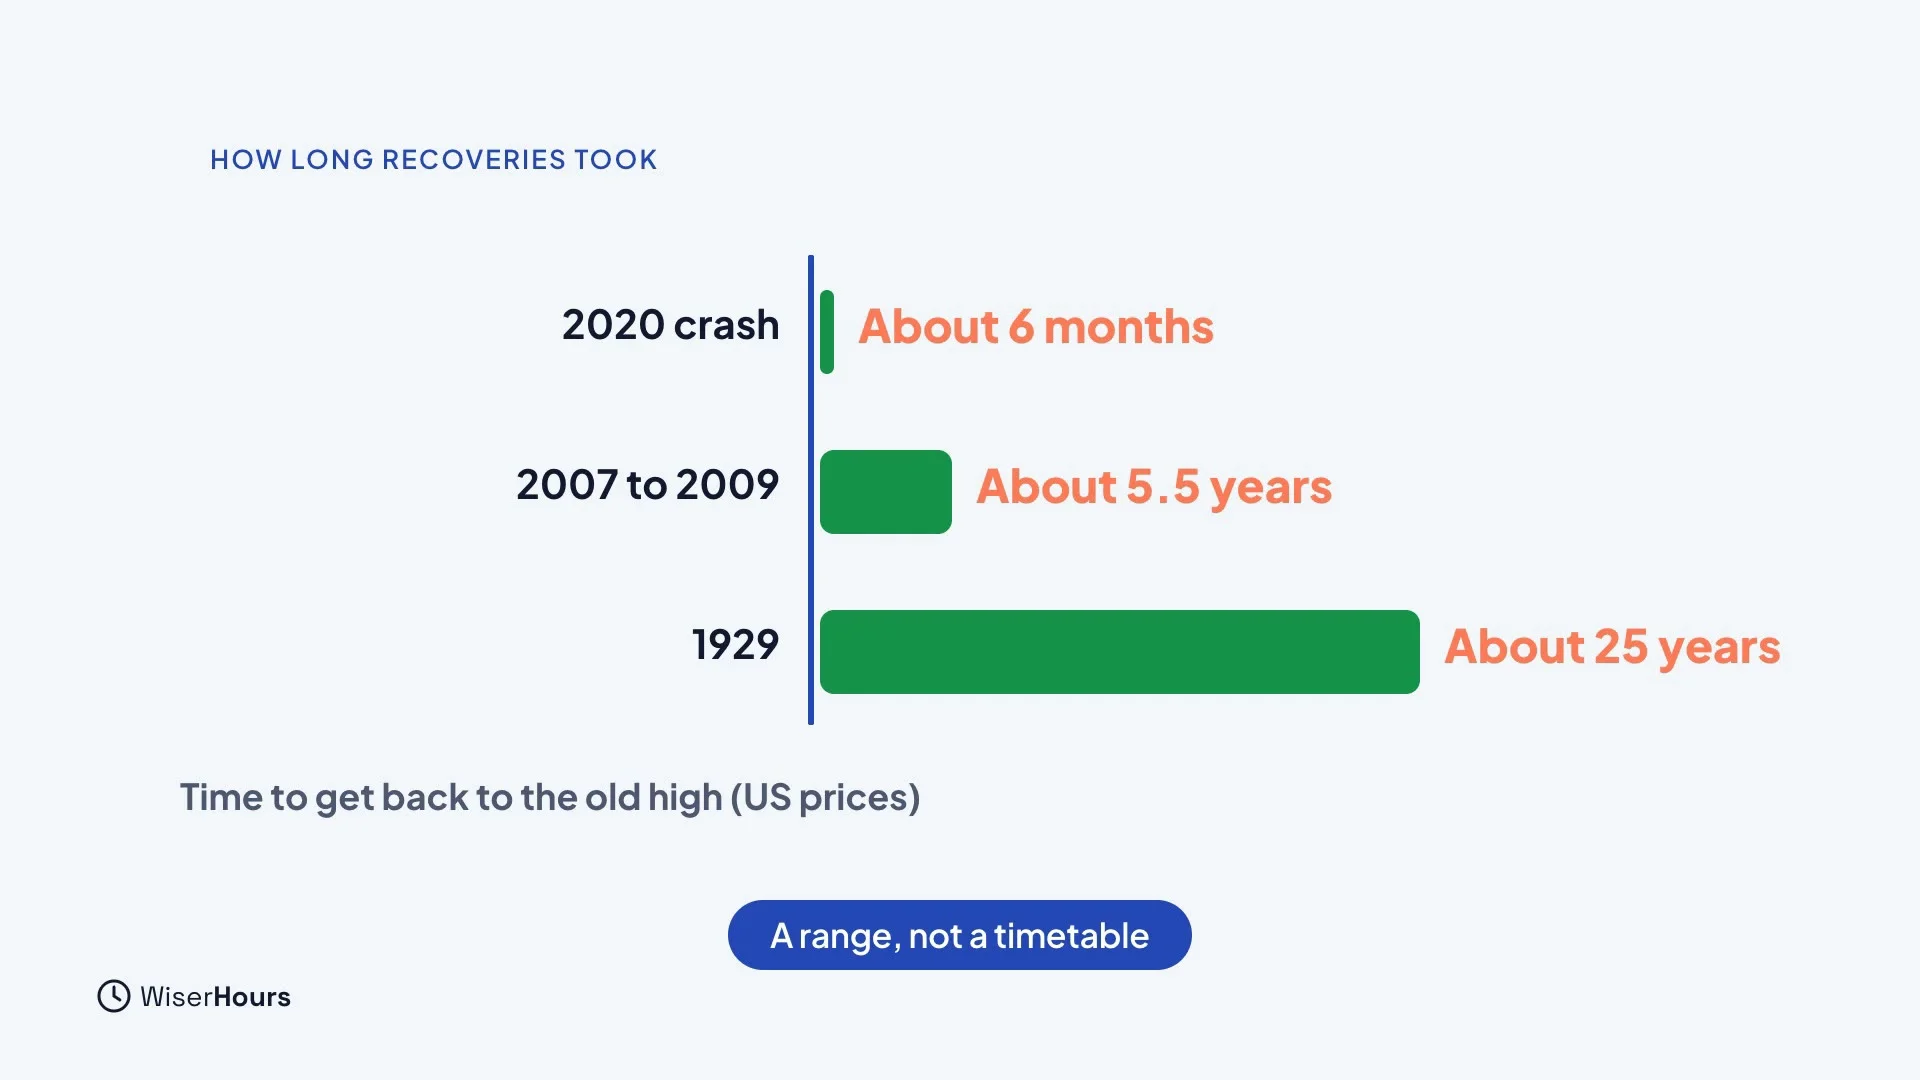
Recoveries have varied a lot. After the 2020 crash, US stocks were back to their old high in about six months. After 2008, it took about five and a half years. After 1929, it took about 25 years. History gives a range, not a timetable. Nobody can tell you in advance whether the next fall will be short or long, which is why the plan below matters more than any guess.
 (opens the full-size picture)
The halving maths
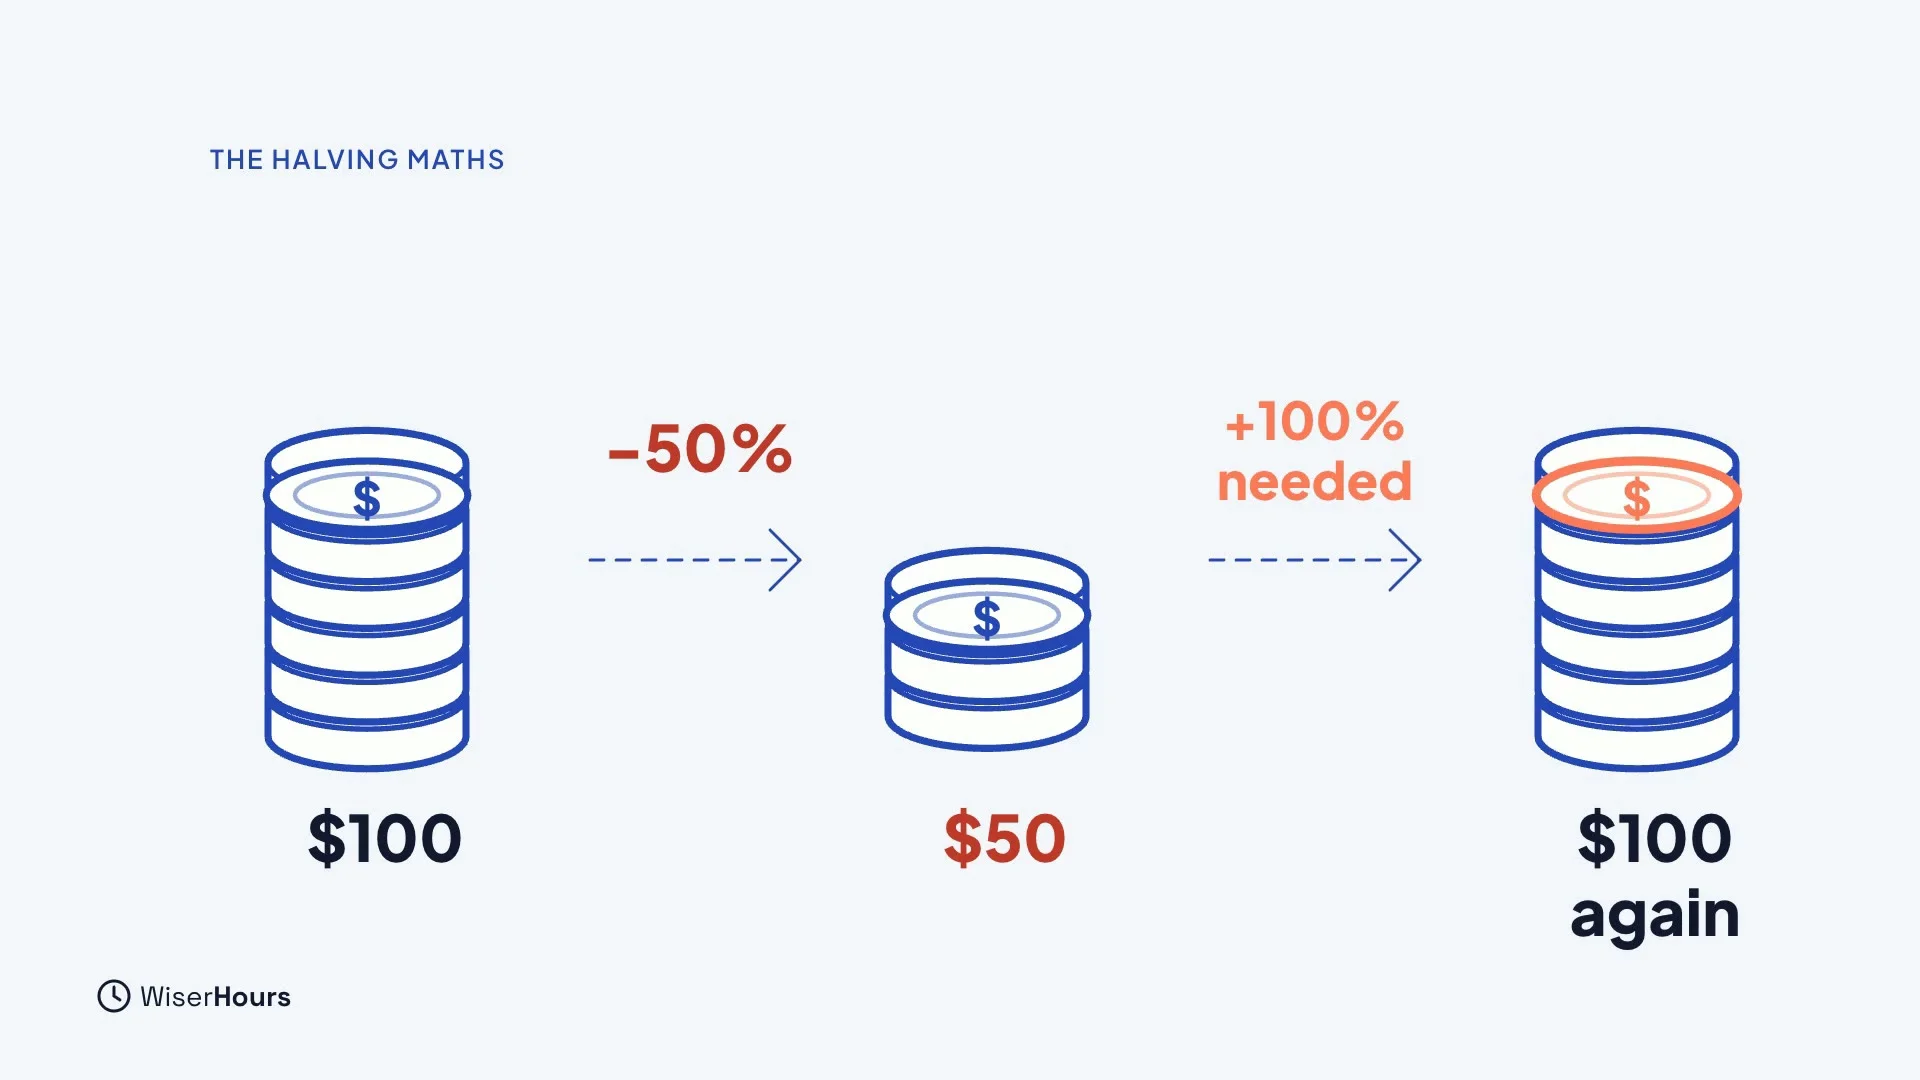
Falls are also harder to recover from than they look. If an investment halves, it has to double to get back to where it was.
 (opens the full-size picture)
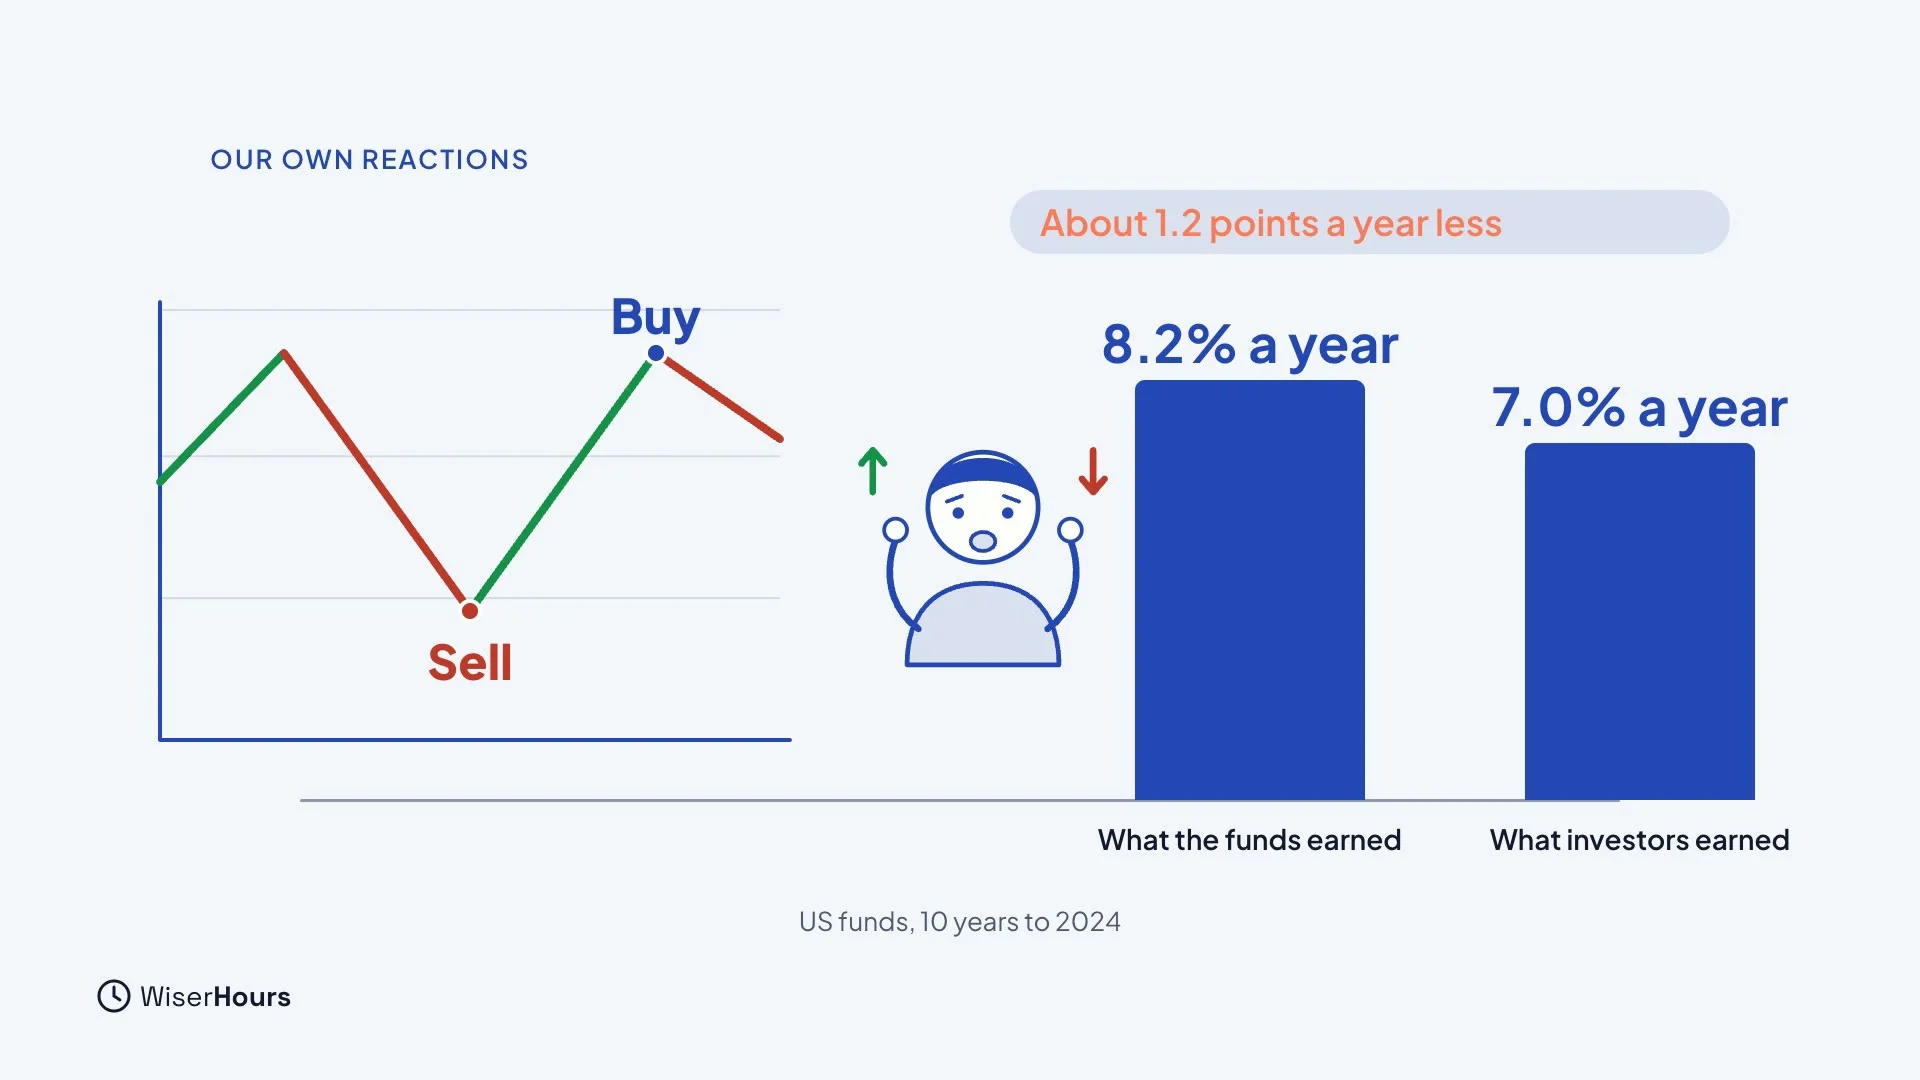
Our own reactions
Often, the biggest danger is our own reaction. People tend to sell after falls and buy after rises. In one study of US funds over ten years, investors earned about 1.2 percentage points a year less than the funds they owned, mostly because of when their money went in and out.
 (opens the full-size picture)
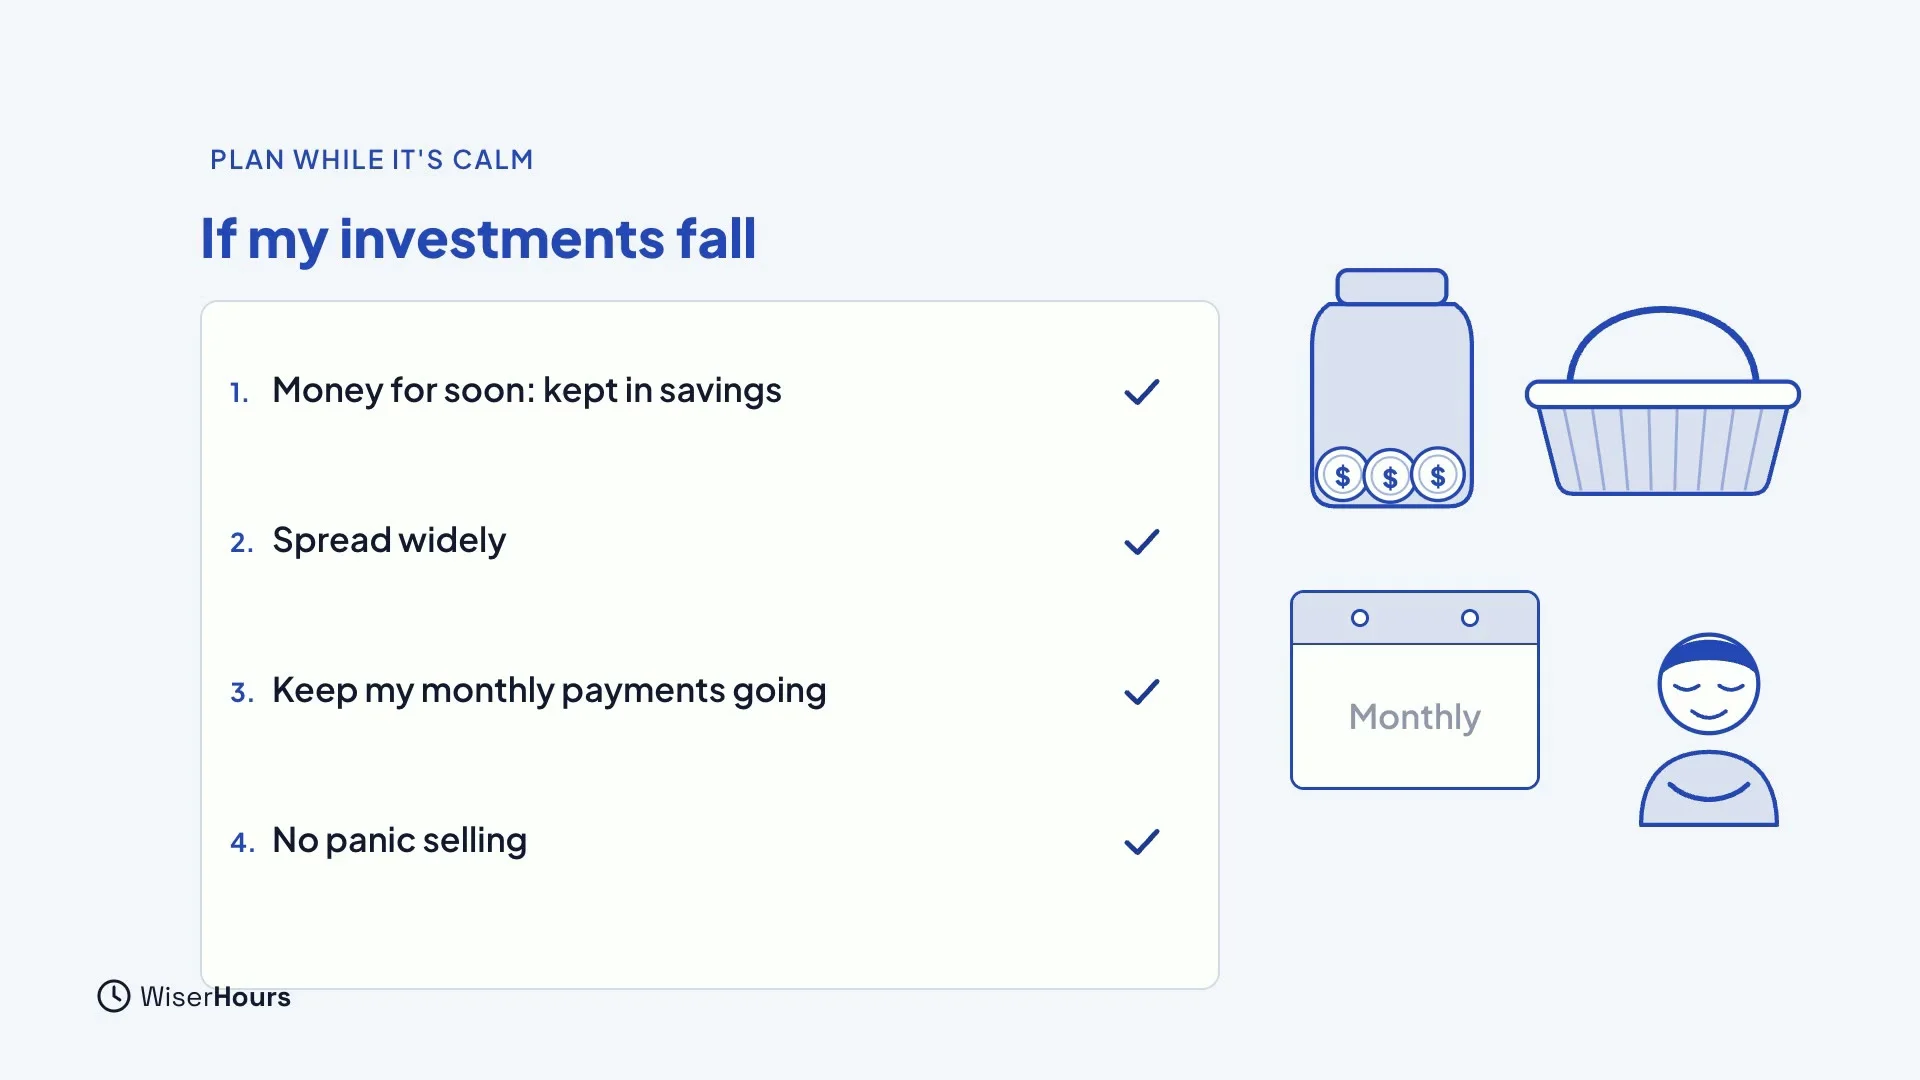
Plan while it is calm
Keep money you will need soon out of the market. Spread your money widely. And write down what you will do in a fall. For example: I will keep my monthly payments going, and I will not sell in a panic.
 (opens the full-size picture)
YOUR TURN
Read more
- Bear Markets Explained: what counts as a bear market, how the counts differ and how long past falls and recoveries lasted.
- The Behavior Gap: why investors can earn less than the funds they own, and what helps.
Read the full lesson script
At some point, your investments will fall, sometimes a lot. In this lesson, you'll see how often that happens, how long recoveries have taken, and how to stay calm when it does.
A drop of 10 percent or more from a recent high is called a correction. A fall of 20 percent or more is usually called a bear market. These are just labels, and nobody officially declares them.
Bear markets are a normal part of investing, so a fall does not mean something has gone wrong with your plan. One count finds 27 of them in the US since 1928. On average, they've lasted about ten months. The rises in between have lasted much longer, about two and a half years on average.
Recoveries have varied a lot. After the 2020 crash, US stocks were back to their old high in about six months. After 2008, it took about five and a half years. After 1929, it took about 25 years. History gives a range, not a timetable.
Falls are also harder to recover from than they look. If an investment halves, it has to double to get back to where it was.
Often, the biggest danger is our own reaction. People tend to sell after falls and buy after rises. In one study of US funds over ten years, investors earned about 1.2 percentage points a year less than the funds they owned, mostly because of when their money went in and out.
So plan ahead, while things are calm. Keep money you'll need soon out of the market. Spread your money widely, so one bad holding hurts less. And write down what you'll do in a fall. For example: I'll keep my monthly payments going, and I won't sell in a panic.
So remember: falls of 20 percent or more are normal. Recoveries have taken months or years, and the past can't promise the future. And a plan written in calm times helps you hold on. Before the next lesson, write two sentences on what you'll do if your investments fall by a fifth. In the last lesson, you'll learn to spot scams, and you'll put your whole plan together.
MAKE IT A SMALL WIN
Finished this lesson?
Mark it complete to save your progress on this device.